PISONICS
PS7000 Series
Ultrasonic Slurry Density Meter
Acoustic impedance · non-nuclear · sensor flush with the pipe wall
Coal Preparation Thickeners — Feed and Underflow Solids Concentration
—— A dilute feed that often runs part-full, a dense underflow that is often pumped intermittently ——
【Key measurements: solids concentration g/L / slurry density】
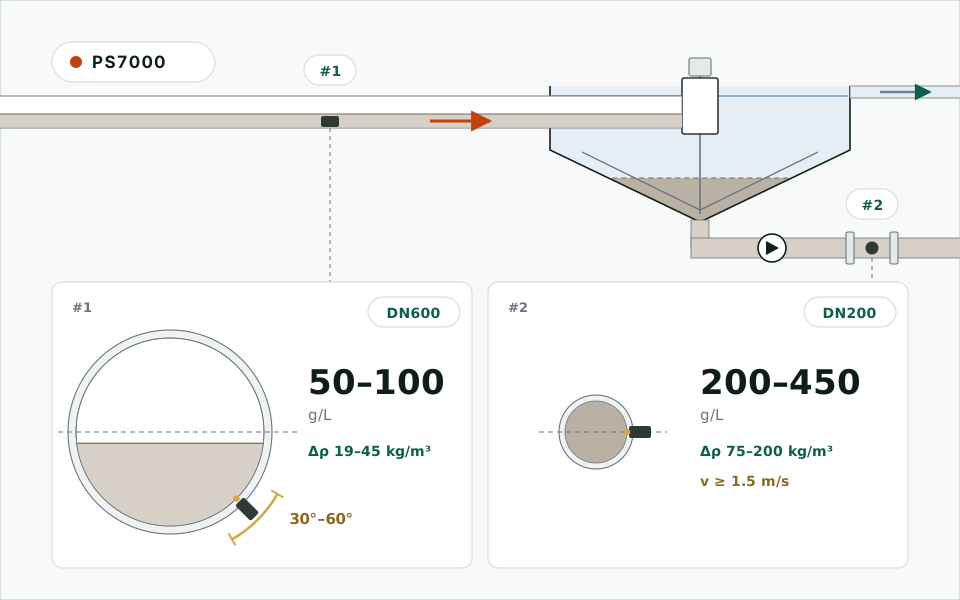
Two Points, an Order of Magnitude Apart
In a coal preparation plant the thickener feed sets the flocculant dose and the thickener underflow sets how hard you can pull the bed and how the filter press is fed. Both are slime-water concentration measurements, but they sit an order of magnitude apart: the feed is dilute and usually runs part-full in a gravity line; the underflow is dense and pumped, often intermittently. Plants cover these points with nuclear gauges, with insertion fork meters, or with grab samples. This page explains why forks foul here, and what a non-nuclear ultrasonic meter needs to work on both lines.
| Point | Typical line | Concentration | Approx. % solids w/w | Density above water |
|---|---|---|---|---|
| ① Thickener feed | Large-bore gravity line, often part-full | 50–100 g/L | 5–10 % | 19–45 kg/m³ |
| ② Thickener underflow | Full bore, pumped, often intermittently | 200–450 g/L | 18–39 % | 75–200 kg/m³ |
Figures assume a slime solids density of 1.6–1.8 g/cm³. Across the whole feed range the slurry density moves by only about 20 kg/m³ — roughly 0.4 kg/m³ per g/L — while a 20 °C swing in water temperature moves water density by 4 kg/m³, the equivalent of about 10 g/L at the feed. The feed is a small-signal point: temperature compensation, sampling method and the acceptance criterion matter far more than they do on the underflow. The slurry concentration calculator converts between density, mass and volume concentration (g/L = mass fraction × slurry density).
Why a Fork Stops Reading True Here
A vibrating fork weighs the thin layer of liquid its tines drag along. Anything that sticks to the tines becomes permanent added mass. In coal slime that happens four ways:
- Coating. Fine clay-rich slime and flocs build up at the root of the tines and between them. The reading drifts high and still looks plausible.
- Bridging. Flocs or fibre bridge the gap between the tines; the reading jumps or the meter stops resonating.
- Bubbles. Air from a drop-in feed or a mixing point clings to the tines and biases the reading low.
- Wear. Coarse particles in the underflow thin the leading edge; the frequency drifts slowly.
This is a consequence of putting a resonator in the stream, not of any one brand. Hard coatings slow wear; they do nothing about build-up. We make a fork meter too (PS7400) — it belongs in clean liquids, chemical acids and alkalis, and tanks, not here. See tuning fork density meters for the full boundary.
How PS7000 Measures
PS7000 measures acoustic impedance with a single chirped ultrasonic transducer. The sapphire window sits flush with the pipe wall and does not project into the flow, so there is no root or gap for flocs to hang on. There is no radioactive source, so no licensing, leak testing or disposal.
Alongside the concentration it reports a 0–100 gas index, echo energy, signal quality and a fault word over Modbus; the two 4–20 mA loops follow NAMUR NE43 and go to 3.5 mA on a fault by default, so the DCS can tell a failure from a reading.
It has its own failure modes, and we state them: a mud film on the window makes the reading creep up and flatten out (echo energy and signal quality show it); free gas biases acoustic readings high, which only siting can avoid; and a change of coal calls for a calibration check.
Mounting Decides the Outcome
① Underflow (full bore)
- Prefer a vertical upward run. On a horizontal line, mount at mid-height on the side of the pipe, away from settled solids at the invert and air at the crown.
- Straight run ≥ 10D upstream and ≥ 5D downstream (5D / 3D minimum). Keep velocity above the deposition velocity — about 1.5–1.7 m/s for a DN200 (8-inch) line in coal slime.
- On intermittent pumping, gate the measurement with the pump-running signal: after a stop the slurry settles and the reading creeps up without meaning anything.
- Provide a flush connection, and set the 20 mA point well above the highest expected concentration.
② Feed (part-full)
A part-full line can be measured as long as the sensor face stays submerged under every operating condition. On large existing lines use the weld-in boss (Ø60 mm hole) on the lower half of the side wall, 30°–60° below the horizontal centreline: the lowest operating level limits the angle from above and any deposit at the invert limits it from below. For a DN600 (24-inch) line:
| Angle below centreline | Window centre above invert | Minimum operating level needed |
|---|---|---|
| 30° | 150 mm | ≥ 227 mm |
| 45° | 88 mm | ≥ 160 mm |
| 60° | 40 mm | ≥ 107 mm |
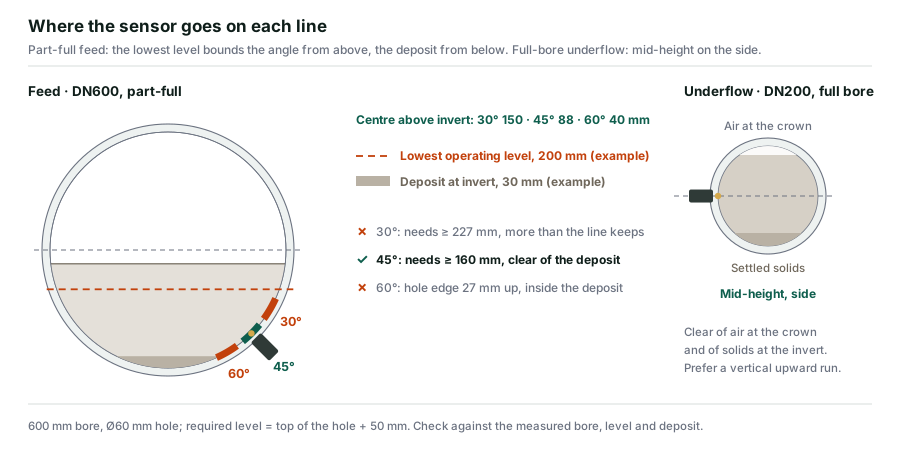
The feed angle is chosen between the lowest operating level and the deposit at the invert (level and deposit in the figure are an example); on the underflow the sensor sits at mid-height on the side
- Required level = top edge of the hole + 50 mm margin. Take the lowest level at low load and during start-up and shutdown, and check against the measured bore.
- Put the sample point beside the sensor at the same height, so any vertical concentration gradient is built into the calibration.
- Keep clear of drop-ins, side-stream impacts and flocculant mixing points upstream.
- If the level falls below the window the reading drops to the bottom of the range with no fault code — gate it with feed flow or level in the DCS.
Calibration and Acceptance
- Use oven-dried gravimetric samples as the reference, not quick density-cup checks; sample at the sensor at a recorded time, and take meter values from the DCS or cloud log.
- Spread calibration points across the range (at least three near each end). The meter fits Y = aX + b with up to 20 points and, from three points on, refuses to write a fit with r² below 0.8; calibration is done online, without a shutdown.
- Accept on at least 20 paired samples, judged on mean bias, trend agreement and the standard deviation of the differences. For the underflow the ±1 % (w/w) specification is a reasonable basis; for the feed, ±1 % w/w is about ±10–11 g/L — too coarse to be a useful criterion, so agree the figure from trial-period data.
Buying from China
CE marked; Ex d IIC T6 Gb available on order. Quotations in USD or EUR, EXW / FOB / CIF, with HS code and declaration of conformity. Send the line sizes and materials, the lowest operating level on the feed line, the underflow pumping pattern and the water temperature range, and the selection takes one exchange.