Limestone Slurry Density Reading Pinned at the Upper Range Limit? Check the Sensor Face Before Touching the Calibration Coefficients
Chirped ultrasonic acoustic-impedance measurement replaces vibrating fork and differential pressure density meters, providing the on-line concentration signal for closed-loop powder feed and make-up water control
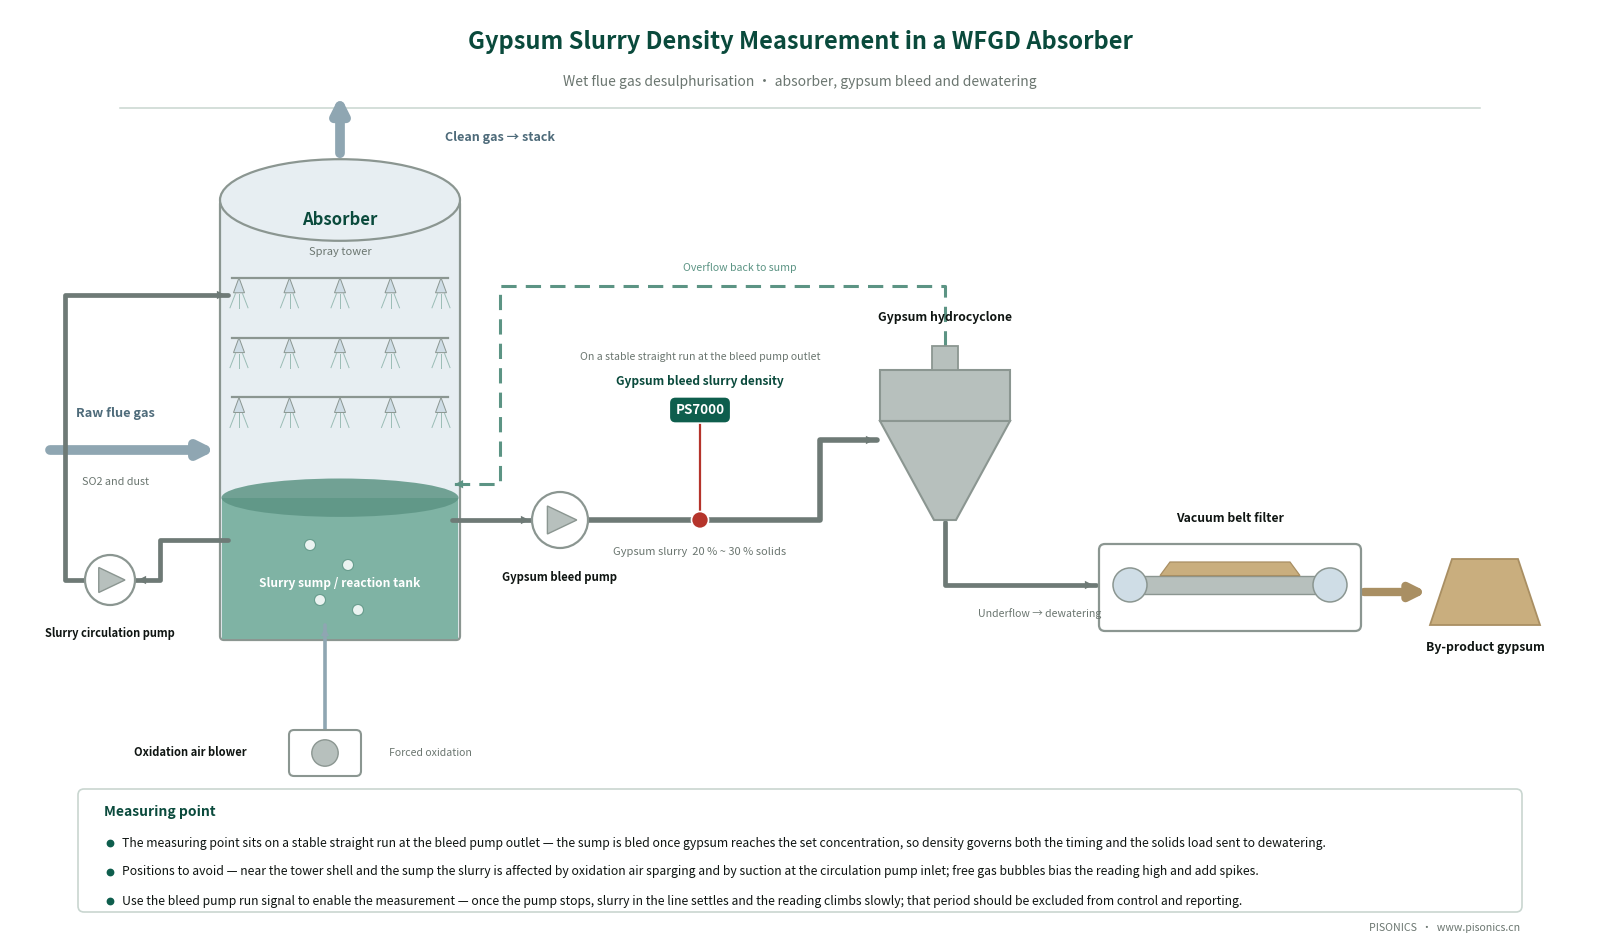
Scope: the limestone slurry preparation section of wet flue gas desulphurisation (WFGD) plants — slurry tank outlet, slurry circulation line, and the transfer line from the feed pump discharge to the absorber
▍Project Snapshot / Process Conditions
Customer industry | Thermal power / wet flue gas desulphurisation (WFGD) |
Region | A 2×600 MW unit in eastern China |
Measured medium | Limestone slurry, CaCO₃, approx. 20 % ~ 30 % concentration by weight |
Medium temperature | Ambient temperature (meter rated 0 ~ 80 ℃) |
Pipe size / installation | DN150 ~ DN250 slurry circulation line / transfer pump discharge line; measuring spool flanged into the line, non-intrusive sensor |
Range / accuracy | 0 ~ 80 % concentration by weight, ± 1 % FS (the published datasheet figure is ± 1 % concentration by weight), calibratable on the actual medium |
Field calibration | Gravimetric sampling method; online calibration, no shutdown required |
Replaces | Vibrating fork / differential pressure density meter |
Operating record | Three months of continuous service since commissioning (as reported by the plant) |
1 Process Background and Measurement Challenges
▍1.1 Preparation concentration sets the Ca/S ratio and is the upstream parameter governing FGD energy consumption and emission compliance
Limestone slurry is the "ammunition" with which a WFGD system consumes SO₂. Powdered limestone (CaCO₃) is delivered by belt or pneumatic conveying into the powder silo, dosed at a set rate through the feeder valve into the slurry preparation tank and mixed with process water under agitation to produce a slurry of about 20 % ~ 30 % concentration by weight, which transfer pumps then send through long pipelines to the absorber to take part in the desulphurisation reaction.
The preparation concentration directly determines the calcium-to-sulphur ratio (Ca/S) in the absorber, and it acts in four directions at the same time:
▪Concentration too high — excess CaCO₃ is fed into the tower per unit time and unreacted particles leave with the gypsum, wasting limestone powder and aggravating scaling inside the tower;
▪Concentration too low — the effective calcium delivered at the same slurry flow is insufficient, desulphurisation efficiency falls and SO₂ emissions risk exceeding the permitted limit;
▪Fluctuating concentration — the relationship between slurry valve opening and Ca/S ratio is no longer stable, the DCS cannot build a reliable feedforward, and operators are left to intervene manually and frequently;
▪Powder consumption accounting — actual limestone consumption has to be derived from concentration and flow; without an on-line concentration value it can only be estimated roughly from the silo level.
The slurry preparation section tests an on-line instrument differently from the absorber: the dominant problem here is not entrained gas but settling and scaling. Fine limestone particles are hard and settle quickly, and the preparation system starts and stops frequently with unit load; during idle periods the slurry stands in the pipe for long stretches, and the pipe wall and any instrument surface facing the flow scale up and silt up readily. If selection and location of the measuring point focus only on the accuracy figure, the price is usually paid in maintenance workload within six months of commissioning.
▍1.2 Limitations of Existing Measurement Methods
▪Vibrating fork / rotor-type density meters: the fork tines or rotor protrude into the flow path and take the full abrasion of fine limestone particles; the plant reports clear wear after 6 ~ 12 months of operation, appearing as zero drift and range compression.
▪Differential pressure / diaphragm density meters: particularly sensitive to scaling. Because the preparation system starts and stops frequently and the slurry residence time is long, the diaphragm face scales and silts up readily; the plant reports 1 ~ 2 shutdown cleanings per month.
▪Gamma (nuclear) density gauges: accurate and reliable, but slurry preparation is a mature process whose control accuracy requirements are not extreme. Carrying the whole-life compliance cost of a radiation safety licence, annual inspections, personnel qualification and source decommissioning and disposal for such a duty is poor value, and these gauges are gradually being replaced.
▪What happens without a stable on-line concentration: when the data lag or jump around, the PLC / DCS cannot close the "powder feed / water make-up" loop; operation falls back on the experience of the patrolling operator and the concentration band is forced wider.
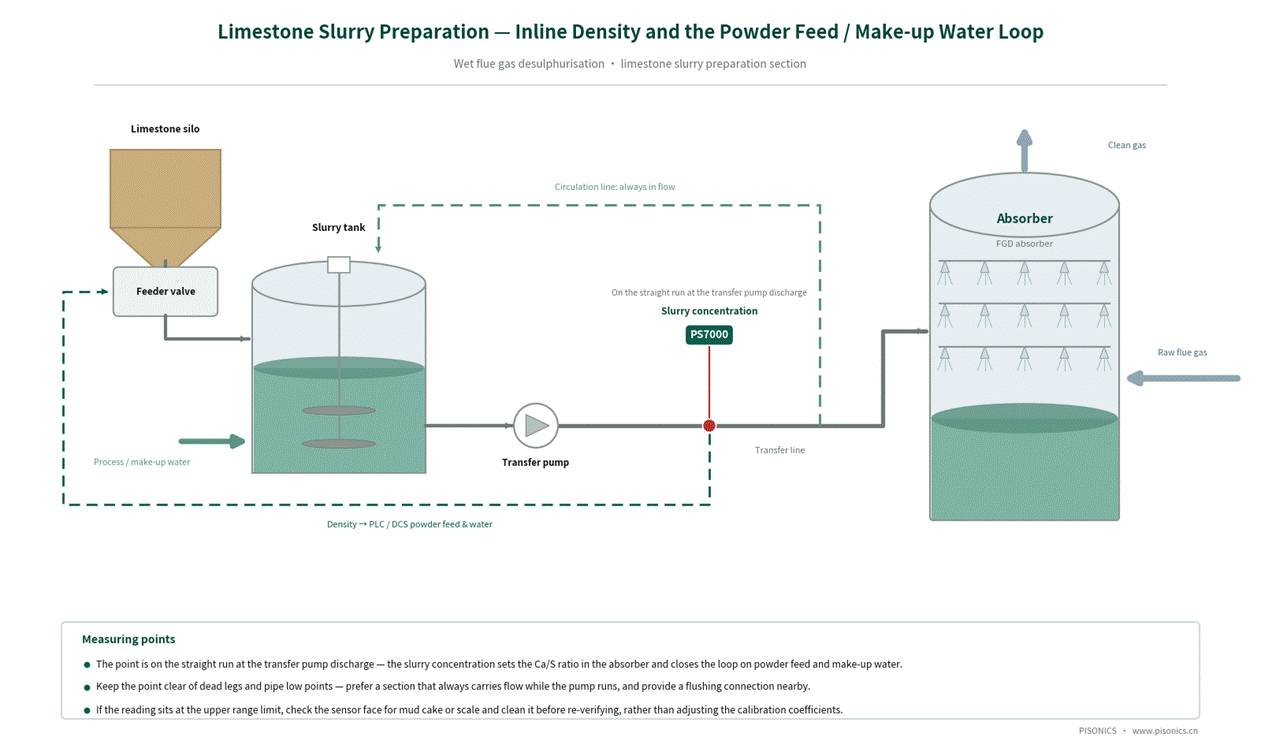
Figure 1 On-line density measurement in the limestone slurry preparation section and the powder feed / make-up water control loop
2 The PS7000 Technical Approach
▍2.1 Measuring principle: the chirped (linear frequency modulation) acoustic-impedance method
When an ultrasonic wave travelling in a medium meets a solid-liquid interface, the echo amplitude is determined by the difference in acoustic impedance across that interface, and acoustic impedance Z = medium density ρ × sound velocity c is directly related to the density of the medium. The PS7000 uses a single self-transmitting, self-receiving sensor that continuously emits chirped (linear frequency modulation) ultrasonic pulses and acquires the echoes in real time. The wide bandwidth of the chirp signal helps the pulse penetrate bubble layers and suppresses multiple-reflection interference, and the transmitter then resolves the acoustic-impedance signature of the echo to recover the density of the medium.
The fundamental difference from the gamma-ray method is that the PS7000 contains no radioactive source of any kind. It is a non-nuclear instrument: no radiation safety licence is required, and there is no annual source inspection, no radiation-worker qualification and no source decommissioning and disposal.
▍2.2 Non-intrusive measurement: the sensor is wetted but does not protrude into the flow path
The PS7000 measuring spool is flanged into a straight run of the process line and the ultrasonic sensor is mounted on the spool. This is the key structural difference from conventional insertion-type instruments, and the point most often misunderstood during selection, so it is set out here exactly as it is worded in the Operating Manual:
▪Non-intrusive (non-intrusive is not the same as non-contact): the sensor must be wetted by the medium in order to work, but it does not protrude into the flow path — there is nothing projecting into the bore. The manual is explicit on this point: for horizontal installation with the sensor on top of the pipe, a full pipe must be guaranteed, otherwise the sensor loses contact with the liquid and the measurement fails; for remote-mount horizontal installation the sensor should be placed on the underside of the pipe so that it stays wetted.
▪There is therefore none of the leading-edge erosion, build-up at the probe root or downstream flow disturbance associated with insertion probes, and no risk of blocking the line.
▪The acoustic window of the sensor is sapphire: a fine surface finish, wear-resistant and corrosion-resistant. The measuring spool can be supplied with a lining (PTFE / rubber / ceramic) to suit the duty.
▪Heavily scaling media should still be included in routine inspection — the manual lists "scaling on the sensor face" as one of the items to check when calibration fails, the remedy being to clean the sensor and recalibrate.
▪Applicability limits: bubbles in the medium are permitted; the medium should not, however, contain large quantities of suspended or settled coarse particles.
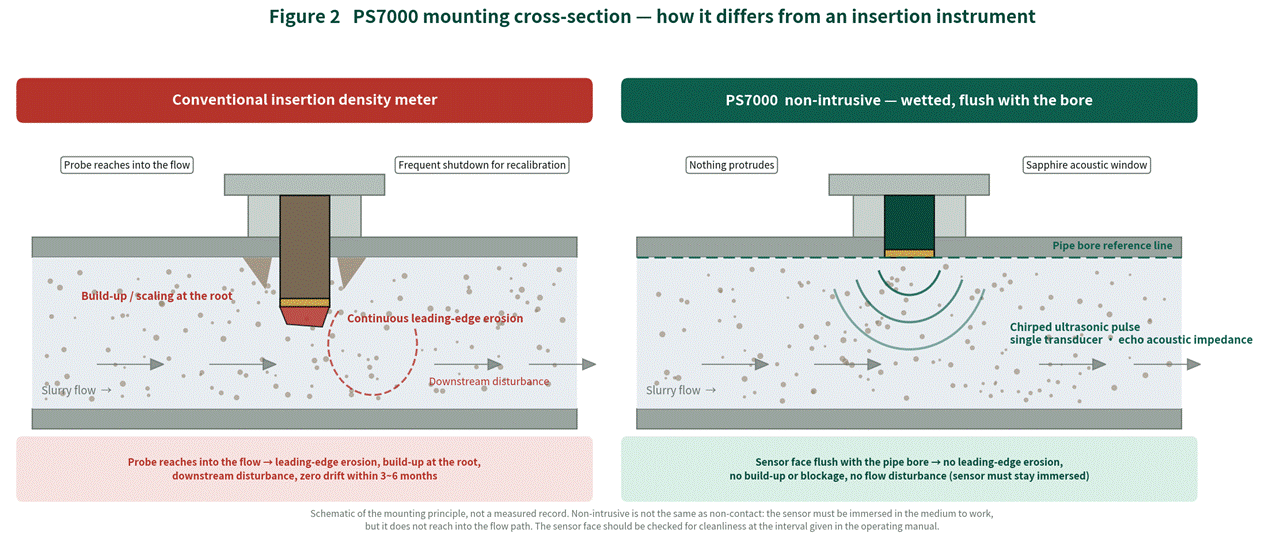
Figure 2 Sectional view of the PS7000 installation — the structural difference from conventional insertion types (schematic drawing of the principle, not a record of measured data)
▍2.3 Key Technical Specifications
Item | Specification | Item | Specification |
Measuring principle | Chirped ultrasonic acoustic-impedance method | Pipe diameter | DN50 ~ DN1000 |
Measuring range | 0 ~ 80 % concentration by weight / calibratable on the actual medium | Installation | Integral / remote-mount, flanged into a straight run |
Accuracy | ± 1 % FS (the published datasheet figure is ± 1 % concentration by weight) | Dimensions | 288 (W) × 190 (D) × 95 (H) mm |
Power supply | Standard AC220V (175 ~ 285V, 50/60Hz); DC24V optional | Weight | Approx. 2.5 kg |
Power consumption | ≤ 1 W | Display | OLED screen (bilingual Chinese / English menu) |
Ambient temperature | -30 ℃ ~ 60 ℃ | Analogue output | 4-20 mA, 2 channels |
Medium temperature | 0 ℃ ~ 80 ℃ | Digital interface | RS485 / Modbus RTU, approx. 500 m |
Humidity range | ≤ 98 %RH | Ingress protection | IP65 |
Data storage | 2000 real-time records + 400 daily records (customisable) | Remote transmission | Optional 4G module |
Field calibration | Gravimetric sampling method, performed online with no shutdown | Custom options | Lining, range, explosion protection, high temperature and similar options built to the duty |
※ Limestone slurry settles readily and has a marked scaling tendency. A flushing connection should be provided close to the measuring spool, and inspection of the sensor face should be listed as a shutdown maintenance item; lining and sensor materials can be specified at the selection stage according to slurry abrasiveness.
▍2.4 Selection and Installation Requirements (important)
The following conditions directly determine the stability of the measurement in the field. We recommend confirming them while the measuring point is still being designed; doing so avoids the great majority of post-commissioning disputes over deviation.
▪Vertical installation with upward flow is preferred. For horizontal installation, confirm that the medium is not stratified and that the measuring point is representative.
▪Flow velocity > 1 m/s; the higher the density of the solid phase, the higher the velocity required. Avoid low-velocity or stagnant duties, in which particle settling disturbs accuracy and stability.
▪Straight run requirement: the installation position should be well clear of pumps, valves, bends and other local resistances; for horizontal installation, 10D upstream / 5D downstream of straight run must be provided (5D upstream / 3D downstream as an absolute minimum).
▪Keep the sensor wetted: for integral horizontal installation with the sensor on top of the pipe, the pipe must run full; for remote-mount horizontal installation the sensor should be placed on the underside of the pipe. Where the pipe does not run full, the remote-mount version is preferred.
▪Avoid points where free gas bubbles accumulate. Aeration, twin-pump suction, negative-pressure inlets and similar conditions introduce large quantities of free gas bubbles; the bubbles raise the echo energy and bias the reading high. This is an inherent limitation of the acoustic method and must be handled by the choice of measuring point, not by compensating in calibration.
▪The comparison sampling point should be as close as possible to the measuring point. A sampling point far from the measuring point introduces transport lag, so the laboratory reference value and the displayed reading no longer refer to the same moment, and the difference is easily mistaken for instrument error.
▪A sensor face buried under mud cake or scale is the primary failure mode in this section: limestone slurry settles quickly and scales readily, and the preparation system starts and stops frequently, so after a long idle period the sensor face may be covered by mud cake or a scale layer. The ultrasonic pulse then gets no usable echo and the meter outputs a fixed value close to the upper range value (URV) — on a limestone slurry site the reading stayed pinned at 1600 kg/m³ for a long period, with no relationship whatsoever to the true slurry density. The check is straightforward: drain the pipe or fill it with clean water and the reading should return to about 1000 kg/m³; if it stays at the upper range limit and barely follows the process, the sensor face is almost certainly covered and should be removed, inspected and cleaned before re-calibration. Never adjust the calibration coefficients while the sensor face is covered — that only freezes the error into the coefficients.
▪Choose a location away from dead legs and pipe low points: prefer a continuously circulating section that always carries flow while the pump is running, and avoid the ends of branch lines, bypasses and pipe low points — these are where slurry settles most severely after a shutdown, which both buries the sensor and gives an unrepresentative concentration. Where the process allows, provide a flushing connection close to the measuring spool so that the sensor face can be washed during shutdowns, keeping inspection costs to a minimum.
▍2.5 Field calibration: the gravimetric sampling method, performed online
Calibration brings the displayed value into agreement with the true density of the medium: several pairs of "instrument reading + corresponding laboratory reference value" are collected and the instrument automatically regresses the correction coefficients. The whole procedure requires no shutdown and can be carried out online provided the process is steady and the sensor is clean.
Process conditions to be confirmed, item by item, before calibration:
Full pipe | The sensor must be completely immersed in the liquid |
Steady flow | Variation within ± 5 % |
No significant bubbles | No venting operation should be in progress in the line |
Steady temperature | A change in slurry temperature affects the measurement signal |
Clean sensor | No significant deposit or scaling; rinse with clean water if necessary |
The most common situation in the field is that only the process medium is available and clean water cannot be introduced temporarily. In that case two consecutive acquisitions are made on the same medium (about 2 minutes each, about 4 minutes in total): the two measured points plus the virtual zero point added automatically by the system form three regression points, and the instrument uses the goodness of fit r² to cross-check the consistency of the two signals. If bubbles, a step change in flow or an abnormal valve movement during acquisition make the two data sets inconsistent, the system rejects the calibration outright rather than returning an incorrect coefficient. This is the key mechanism that prevents a calibration that looks successful but is in fact wrong.
Recommended calibration interval: calibrate a newly installed instrument once within the first 12 ~ 24 hours of operation; once operation is stable, verify every 6 ~ 12 months; verify every 1 ~ 3 months at measuring points with demanding accuracy requirements; recalibrate immediately after changing the sensor or the medium.
3 Before / After Comparison
Aspect | Previous vibrating fork / differential pressure solution | PS7000 solution |
Abrasion and drift | Inserted fork tines / diaphragm face the flow directly; the plant reports zero drift and range compression after 6 ~ 12 months | The sensor does not protrude into the flow path, so there is no leading-edge erosion mechanism; calibration can be re-checked on line |
Scaling and maintenance | The plant reports 1 ~ 2 shutdown cleanings per month | The smooth sensor surface resists scaling but should still be covered by routine inspection; with a flushing connection provided, it can be washed during a shutdown without removing the meter |
Concentration control | Concentration fluctuates by about ± 5 %; powder feed adjusted from operator experience | Three months after commissioning the plant reports the concentration band narrowed to within ± 1 %, with powder feed and make-up water adjusted by the system from the on-line concentration |
Compliance and safety | The gamma solution requires a radiation safety licence, annual inspection and source decommissioning and disposal | Non-nuclear and radiation-free; no radiation-related approvals involved |
Measurement performance | — | ± 1 % FS (the published datasheet figure is ± 1 % concentration by weight) over the full 0 ~ 80 % range, calibratable on the actual medium |
System integration and traceability | Usually a single analogue output, with no internal data storage | 4-20 mA × 2 + MODBUS-RTU, optional 4G; internal memory of 2000 real-time records + 400 daily records for fault tracing |
4 Field Verification and Operating Record
On the slurry preparation system of a 2×600 MW unit in eastern China, a PS7000 was flanged into the slurry tank outlet line. Three months after commissioning the plant reported that the slurry concentration band had narrowed from about ± 5 % to within ± 1 %; in the operators' own words, "the powder feed rate is now decided by the system rather than by experience". These figures follow the plant's own operating statistics; the statistical method and sample size should be verified with the customer before the figures are quoted.
One typical failure mode of the limestone slurry preparation section should be described alongside these results. We have met the following situation on comparable sites: the reading sits at the upper range limit for long periods (1600 kg/m³, for example) and barely follows the process. The first reaction on site is that "the calibration has drifted", and coefficients are adjusted repeatedly to no effect. The real cause was a sensor face completely buried under mud cake and scale: with no usable echo the output is clamped at the upper range limit — a number with no relationship at all to the true slurry density. Only one step is needed to identify it: after the pipe is drained or filled with clean water the reading should return to about 1000 kg/m³, and if it is still at the upper limit the diagnosis is confirmed. Once the sensor face had been cleaned and the meter re-calibrated, the reading returned to normal. Since then we list "inspection and flushing of the sensor face" explicitly in the shutdown maintenance schedule for limestone slurry preparation points, and we recommend providing a flushing connection for the measuring spool at the design stage.
A Note on Comparison Methodology The gravimetric sampling method itself carries method error: the physical distance between the sampling point and the measuring point introduces transport lag, and the representativeness of the sampling operation together with the weighing and drying accuracy in the laboratory also contribute to the deviation. We therefore avoid expressions such as "in complete agreement", and recommend instead that acceptance be based on the mean deviation and the trend consistency across several consecutive comparison sets, with the sampling rules stated explicitly in an annex to the contract. Pisonics can provide a standard field comparison and acceptance procedure. |
▍Verifiable Benefits for the Customer
▪Three months after commissioning the plant reported that the preparation concentration band had narrowed from about ± 5 % to within ± 1 %.
▪Powder feed and make-up water can be adjusted by the control system from the on-line concentration, reducing reliance on the patrolling operator's judgement (as reported by the plant's operating staff).
▪The 1 ~ 2 shutdown cleaning and re-calibration jobs per month required by the previous contacting instruments have been eliminated, freeing up maintenance windows on the preparation system.
▪No licence, annual inspection or source decommissioning and disposal for radiation-based measuring equipment; the internal memory of 2000 real-time records + 400 daily records provides traceable raw data whenever a concentration anomaly has to be investigated.
5 Frequently Asked Questions
Q1 The reading sits at the upper range limit, or does not move at all — has the calibration drifted?
A Leave the calibration alone for the moment. The most common cause of this behaviour is not calibration but a sensor face covered by mud cake or scale — when the ultrasonic pulse gets no usable echo, the meter outputs a fixed value close to the upper range value (URV). On a limestone slurry site the reading stayed pinned at 1600 kg/m³ for a long period, a number with no relationship to the true slurry density. The recommended sequence is: ① drain the pipe or fill it with clean water — the reading should return to about 1000 kg/m³, and if it stays at the upper limit and does not follow the process, the sensor face is almost certainly covered; ② remove the measuring spool and inspect and clean the sensor face; ③ re-calibrate once it is clean. Changing the calibration coefficients first amounts to forcing a failed signal to a value that "looks right", which makes any later problem far harder to trace. The same applies when a reading stays absolutely fixed at some value for a long time — real slurry density always fluctuates slightly, and a completely static reading usually means the signal has already failed.
Q2 Limestone powder is highly abrasive — how long will the sensor last?
A First the structural mechanism: the PS7000 sensor is mounted on the measuring spool and does not protrude into the flow path, so there is nothing projecting into the flow and none of the wear mechanism by which an inserted fork or diaphragm is continuously abraded by solids. This is the most fundamental difference from vibrating fork and rotor-type instruments. The sensor itself uses a specially selected custom material with a smooth, wear-resistant surface, and the lining can be specified for abrasiveness at the selection stage. We do not, however, promise a specific maintenance-free service life. In the slurry preparation section the leading threat is scaling and deposition rather than erosion: scaling on the sensor face causes calibration to fail outright, and in severe cases there is no echo at all and the reading is clamped at the upper range limit. The correct expectation is therefore "substantially reduced maintenance frequency, but inspection still required", implemented by making inspection and flushing of the sensor face a routine shutdown maintenance item.
Q3 Preparation concentration is only 20 % ~ 30 % — is ± 1 % accuracy good enough for a closed powder feed loop?
A For a control-duty measuring point such as slurry preparation it is usually sufficient: ± 1 % FS (published in the datasheet as ± 1 % concentration by weight) across a working range of 20 % ~ 30 % resolves the concentration trend produced by a deviation in powder feed perfectly well, and is entirely usable as the input to a "powder feed / make-up water" loop. If the meter is also to serve as custody-grade metering of limestone powder consumption, a Coriolis mass flowmeter or similar should be used instead. Two further points must be made. First, calibration quality matters more than the nominal accuracy: the first sampling calibration should be completed within 12 ~ 24 hours of installation, with re-checks every 6 ~ 12 months. Second, the preparation system starts and stops frequently; once the pump stops, the slurry in the pipe stagnates and settles and the reading creeps upwards while no longer representing the true concentration. We recommend wiring the slurry feed pump run contact into the control system as a measurement enable, so that density is only accepted while the pump is running and the loop is not disturbed by false data from idle periods.
Q4 Does the sensor actually touch the medium? Will it be worn away?
A It does touch it. The manual's formal wording is "non-intrusive", not "non-contact" — the sensor has to be wetted by the medium to work (with horizontal installation and the sensor on top, the pipe must run full or the measurement fails), but it does not protrude into the flow path and there is nothing projecting into the bore, so the main wear mechanism of insertion probes, the leading edge being continuously scoured by fast-moving solids, does not exist. Please note that some material in circulation describes this arrangement as "non-contact", which is not accurate. Within the Pisonics range, the products that genuinely do not touch the medium are the PS7010 clamp-on type (acoustic attenuation method) and the nuclear gamma-ray density gauge.
Q5 How is it calibrated in the field? Is a shutdown needed? How often?
A By the gravimetric sampling method, carried out from the handheld remote menu, with no shutdown — calibration can be done online provided the pipe is full, flow variation is within ± 5 %, no venting is in progress, the temperature is steady and the sensor is clean. Where only one medium is available on site, two consecutive acquisitions are made on that medium (about 4 minutes in total) and the system cross-checks the consistency of the two signals with r², rejecting the calibration outright if they disagree. Interval: first calibration within 12 ~ 24 hours of installation, verification every 6 ~ 12 months once stable, every 1 ~ 3 months for high-accuracy points, and immediate recalibration after changing the sensor or the medium.
Q6 Should the PS7000 or another model be selected for a given measuring point?
A The PS7000 (ultrasonic acoustic impedance) is aimed at the density of bubble-laden, high-solids slurries. If the pipe cannot be tapped, or an ageing line is being retrofitted, choose the PS7010 clamp-on type (acoustic attenuation); for concentration analysis of clean liquids choose the PS7020 (sound velocity); for scaling-prone acids and alkalis in chemical service choose the PS7400 (vibrating fork); for large-bore mains above DN200 the PS7300 (differential pressure) is an option; for custody-transfer accuracy choose the PS7200 (Coriolis); for multi-component concentration analysis choose the PS7100 / 7110 (spectral / refractometric); for aqueous suspensions the PS7600 (microwave) is available. If the selection is not clear-cut, send us the process data and we will work it out for you.
About Pisonics
Xi'an Pisonics Information Technology Co., Ltd. (PISONICS) specialises in industrial online density and concentration measurement. Its product range covers ultrasonic acoustic impedance, ultrasonic sound velocity, clamp-on acoustic attenuation, spectral, refractometric, vibrating fork, differential pressure, Coriolis and microwave measuring principles, so that a suitable solution can be matched to each duty. The PS7000 Series Ultrasonic Slurry Density Meter is the company's own non-nuclear inline slurry density monitor, and is in service in power plant desulphurisation, non-ferrous and ferrous mineral processing, coal preparation, salt lake chemicals, dredging, municipal sludge and other industries.
Inline Density & Concentration Measurement
Company | Xi'an Pisonics Information Technology Co., Ltd.PISONICS |
Address | Room 15B016, Block A, Olympic Building, North Chang'an Road, Beilin District, Xi'an, Shaanxi, China |
Tel | +86 159-0293-2017 |
info@pisonics.com | |
Web | Chinese site www.pisonics.cn | English site www.pisonics.com |