PISONICS
PS7000 Series
Ultrasonic Slurry Density Meter
Acoustic impedance · non-nuclear · sensor flush with the pipe wall
Coal Flotation Feed — Online Solids Concentration
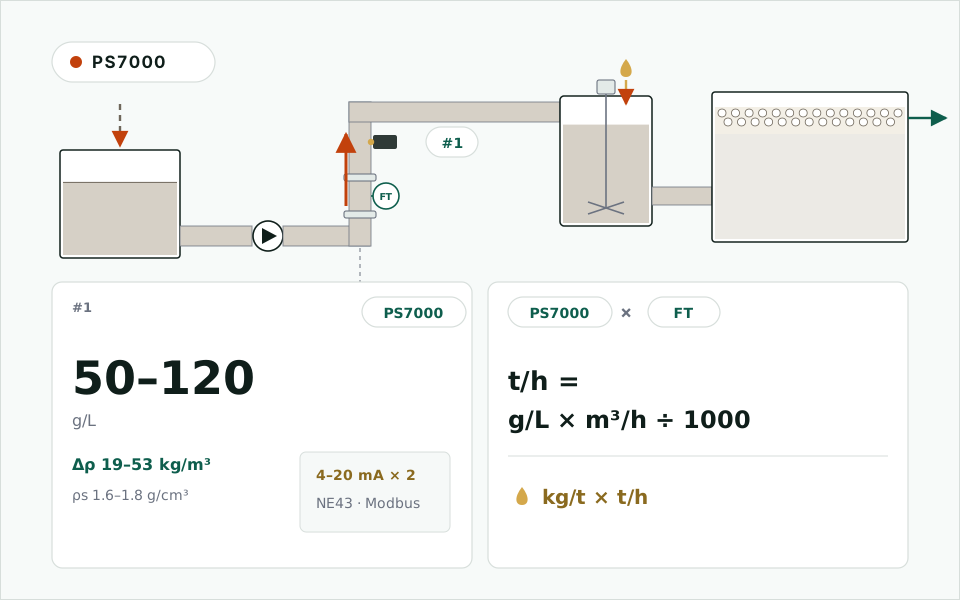
—— Dry solids to flotation = concentration × flow, the feed-forward input to reagent dosing ——
【Key measurements: feed solids concentration g/L / slurry density】
Reagent Follows the Dry Solids
Collector and frother in coal flotation are dosed per tonne of dry solids. Plants that automate dosing usually fit a concentration meter and a flow meter on the flotation feed line, multiply the two into dry solids to flotation (t/h) as the feed-forward term, and trim the dose on clean-coal or tailings ash. A wrong concentration reading takes the feed-forward with it: read high and the circuit is overdosed; read low and it is underdosed and clean-coal ash drifts.
| Item | Typical value | Note |
|---|---|---|
| Feed concentration | 50–120 g/L | Common set points sit between 60 and 100 g/L |
| Density above water | About 19–53 kg/m³ | Slime solids density 1.6–1.8 g/cm³; about 0.4 kg/m³ per g/L |
| ±1 % w/w in g/L | About ±10–11 g/L | 9–21 % of reading, so not an acceptance figure as it stands |
| Water from 10 °C to 30 °C | Equivalent to 9–11 g/L | Temperature compensation and the calibrated temperature span must cover the whole year |
Like the thickener feed, flotation feed is a small-signal point: the meter earns its place by being continuous, stable and open about bad readings, and the acceptance figure comes from site comparison data. The slurry concentration calculator converts between w/w, g/L and density.
How PS7000 Measures
PS7000 measures acoustic impedance with a single chirped ultrasonic transducer. The sapphire window sits flush with the pipe wall and does not project into the flow, so there is nothing for flocs or fibre to hang on. There is no radioactive source, so no licensing, leak testing or disposal.
Alongside the concentration it reports a 0–100 gas index, a bubble flag, echo energy, signal quality and a fault word over Modbus; the two 4–20 mA loops follow NAMUR NE43 and go to 3.5 mA on a fault by default. Bubbles are the commonest upset on flotation feed, and the gas index is what flags those readings.
What to watch: free gas biases acoustic readings high, which pushes the feed-forward to overdose and can only be avoided by siting; an oil or mud film on the window makes the reading creep up and flatten out; and a change of coal or of feed size distribution calls for a calibration check.
Where the Sensor Goes
- On the full line after the feed pump, preferably a vertical upward run; on a horizontal line, at mid-height on the side of the pipe, clear of settled solids and of air at the crown.
- Upstream of the conditioner and the reagent addition point, so the window sees undosed slurry, away from reagent emulsification, air worked in by mixing, and oily collector filming the window.
- Away from pump suction, free-falling gravity sections, sieve-bend underflow launders and sump outlets, where air is drawn in or the line runs part-full; where the feed gravitates into a sump, use the line after the pump.
- Straight run ≥ 10D upstream and ≥ 5D downstream (5D / 3D minimum); velocity above the deposition velocity.
- The flow meter on the same stream and close by, so the two signals line up when multiplied; the sample point beside the sensor at the same height.
- Check the feed size distribution: the datasheet recommends at least 65 % by mass finer than 75 μm (200 mesh); a coarser feed needs representativeness and window wear assessed first.
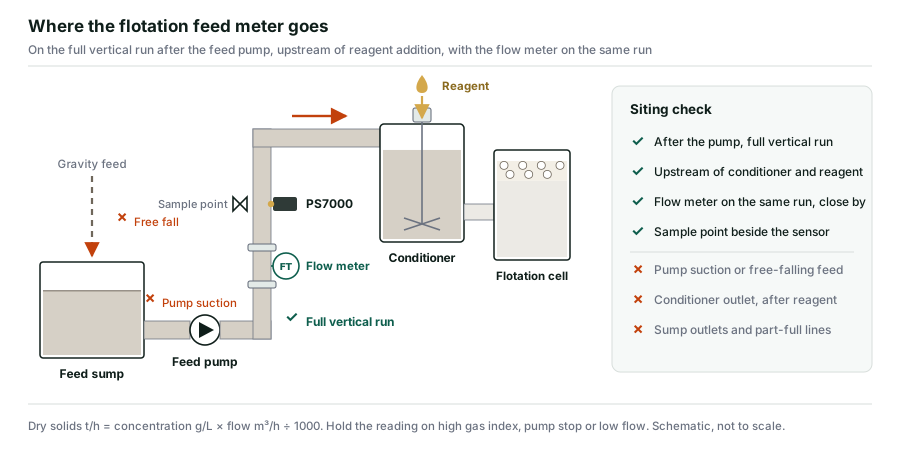
The concentration meter sits on the vertical run after the feed pump, with the flow meter on the same line; the conditioner and reagent addition are downstream (schematic, not to scale)
Working with the Dosing Loop
- Dry solids (t/h) = concentration (g/L) × flow (m³/h) ÷ 1000, computed in the DCS or dosing PLC. PS7000 supplies concentration over 4–20 mA or Modbus; the flow meter is sourced to suit the site, usually electromagnetic.
- When the gas index is above its set point, the feed pump is stopped or flow is below a minimum, hold the last good concentration so bad readings never reach the feed-forward.
- Concentration × flow sets the base dose only; clean-coal and tailings ash still trim it. No single concentration meter should decide the dose on its own.
- Reagent savings come from the whole dosing system — model, ash feedback, actuators and operating practice — and should not be credited to one instrument.
Calibration and Acceptance
- Use oven-dried gravimetric samples as the reference, not quick density-cup checks; sample beside the sensor at a recorded time and take meter values from the DCS or cloud log.
- Spread calibration points across the working range (at least three near each end, for example around 60 and 100 g/L). The meter fits Y = aX + b with up to 20 points and, from three points on, refuses a fit with r² below 0.8; calibration is done online, without a shutdown.
- Plants that alternate coals can keep a calibration per coal and switch between them.
- Accept on at least 20 paired samples, judged on mean bias, trend agreement and the standard deviation of the differences; agree the figure from trial-period data.
In Coal Preparation
PS7000 is in service on flotation feed and thickener feed points in coal preparation plants; customers are not named. See coal slurry thickener feed and underflow and density control of dense-medium suspensions.
Buying from China
CE marked; Ex d IIC T6 Gb available on order. Quotations in USD or EUR, EXW / FOB / CIF, with HS code and declaration of conformity. Send the feed line size and material, the feed concentration and flow range, where the conditioner and reagent addition sit relative to the pump, the water temperature range and the slime size distribution, and the selection takes one exchange.