CASE STUDY · 13
Measuring Available Chlorine and Free Alkali Online: End-Point Determination in Sodium Hypochlorite Synthesis
Multi-component spectral modelling replaces standard-solution titration, giving continuous grounds for alkali make-up and discharge timing on the hypochlorite reaction tower
Scope: sodium hypochlorite synthesis in chlor-alkali plants — the outlet circulation line of the hypochlorite reaction tower (chlorine absorption tower) and the product discharge line; comparable processes extend to disinfectant and bleach preparation and to monitoring alkaline oxidiser solutions in fine chemicals
▍Project Snapshot / Process Conditions
Customer industry | Chlor-alkali chemicals / sodium hypochlorite synthesis |
Region | Sodium hypochlorite unit at a chlor-alkali producer in East China (about 40,000 t/a) |
Measured medium | Sodium hypochlorite circulating liquor (available chlorine + free alkali NaOH, by-product NaCl) |
Medium temperature | 20 ~ 40 ℃; the product literature gives only an operating environment of 0 ~ 60 ℃ and no upper limit for medium temperature, which must be confirmed with Pisonics during selection |
Pipe size / installation | DN50 ~ DN100 reaction tower outlet circulation line, installed in a bypass flow cell at the circulation pump outlet |
Range / accuracy | Customised to the medium (product measuring range 0 ~ 40 %); ± 0.1 absolute accuracy, presupposing a model quality of R² > 0.99 |
Field calibration | MLR modelling from "spectrum + titration value" samples covering the process concentration range; quarterly cross-checks against titration values after commissioning |
Replaces | Standard-solution titration (iodometric / acid-base) + manual reading of the indicator |
Operating record | About 1 year of continuous service since commissioning |
1 Process Background and Measurement Challenges
▍1.1 Available chlorine and free alkali are the two end-point criteria in hypochlorite synthesis
Sodium hypochlorite is a basic chemical for bleaching, disinfection, textiles, paper and fine chemicals, and industrial synthesis takes place mainly in a hypochlorite reaction tower: sodium hydroxide solution is sprayed down from the top of the tower while tail chlorine from the electrolysis section enters at the bottom, and countercurrent gas-liquid contact forms sodium hypochlorite together with by-product sodium chloride and water. Whether a tower batch has reached its end point is judged on two indicators — available chlorine reflects the progress of the reaction and whether the product is on specification, while free alkali reflects the alkali remaining and determines whether more has to be added. If either figure moves outside the process window, the consequences reach beyond the product itself.
▪ Available chlorine too low: the product misses its release specification and chlorination has to continue or the whole tower batch be reworked, tying up tower capacity;
▪ Free alkali too low: continuing to feed chlorine once the alkali is exhausted causes over-chlorination — pH falls, sodium hypochlorite decomposes faster and chlorate may form, and in severe cases free chlorine is released, losing product and creating a safety risk;
▪ Free alkali too high: alkali consumption rises, and excess alkalinity in the finished product affects downstream use and adds to the neutralisation load later on.
There is a further complication: sodium hypochlorite decays of its own accord. Available chlorine in the solution falls continuously with time, and the process is markedly accelerated by higher temperature, exposure to light, insufficient alkalinity and catalysis by metal ions such as iron, copper and nickel — free alkali also acts as a stabiliser in the finished product, so as alkalinity falls the decay of available chlorine speeds up. "How much is in the tower right now" and "how much is left several days after discharge" are therefore two separate questions, and titration once every 0.5 ~ 1 hour answers even the first one only at isolated moments in time.
▍1.2 Limitations of Existing Measurement Methods
▪ Lag in titration analysis: sampling, delivery to the laboratory, titration and reporting take 0.5 ~ 1 hour in total. Chlorine and alkali addition are set from experience, and the end-point decision rests on a single reading by the analyst.
▪ The safety burden of sampling contact: sodium hypochlorite is a strongly oxidising alkaline liquid, residual chlorine gas is present around the tower, and opening a valve frequently to take samples exposes operators to real risk; protective equipment and work permits are themselves a cost.
▪ Reagents, glassware and waste liquid: iodometric and acid-base titration consume standard solutions, indicators and glassware, and the analysis itself generates chlorine-bearing waste liquid that has to be disposed of through the proper route.
▪ The two indicators are never obtained at the same moment: available chlorine and free alkali normally require two separate titration procedures, and manual analysis usually measures one and then the other, so the two figures do not belong to the same instant; using them together to judge the ratio builds in an error from the outset.
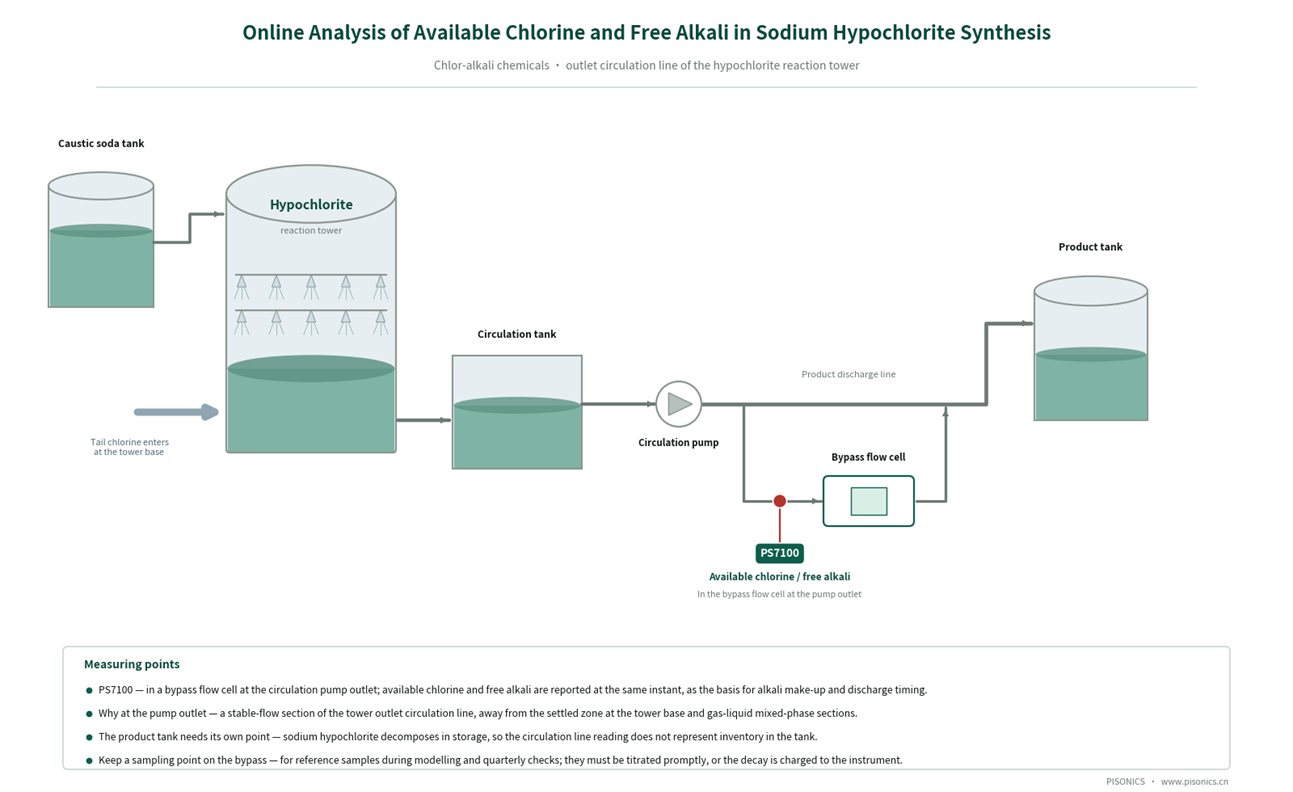
Figure 1 Online analysis of available chlorine / free alkali on a sodium hypochlorite synthesis unit
2 The PS7100 Technical Approach
▍2.1 Measuring principle: UV-Vis-NIR absorption spectroscopy
Spectral measurement is based on the Beer-Lambert law: when a beam of light passes through a liquid containing an absorbing species, intensity is selectively absorbed at particular wavelengths, and absorbance A is linearly proportional to the concentration c of that species and to the optical path length L.
The PS7100 works in four steps: a multi-channel LED source array lights in sequence, emitting full-spectrum pulses covering 255 ~ 1650 nm; the beam passes through the liquid under test and specific molecules absorb photons selectively in their characteristic bands; a Si + InGaAs dual detector array acquires the transmitted intensity synchronously to give a complete absorption spectrum; and the transmitter uses MLR multiple linear regression modelling with Kalman filtering to compute and output the concentration of the medium in real time.
▍2.2 Structure and wetted parts: no reagents and no sampling, but the optical window is wetted
This is the point most often misunderstood during selection, so it is stated explicitly here:
▪ No reagents · no dilution · no sampling · non-destructive: measurement is made in real time directly in the process pipe or vessel, consuming no chemical reagents, requiring no sample preparation and leaving the sample itself unchanged. This is the core value of the spectral method compared with laboratory titration and manual sampling.
▪ But the optical window does contact the medium: the wetted material is a sapphire optical window. Describing this arrangement as "non-contact", as some literature does, is inaccurate — the only product in the Pisonics range that genuinely does not touch the medium is the clamp-on PS7010 (acoustic attenuation method).
▪ The sapphire window uses a self-cleaning design and resists fouling better than ordinary optical materials; even so, for heavily fouling media or media that readily form films, window cleanliness should be part of routine inspection — any fall in transmittance translates directly into reading drift.
▪ Transmission or reflection measurement can be selected, with an optical path of 1 ~ 40 mm chosen according to how strongly the medium absorbs; strongly absorbing media take a short path, weakly absorbing media a long one.
▍2.3 Key Technical Specifications
Item | Specification | Item | Specification |
Measuring principle | UV-Vis-NIR absorption spectroscopy | Spectral response range | 200 ~ 1700 nm (detector) |
Measured media | Clean, homogeneous liquids (chemical solutions, brewing liquids, cleaning solutions, pharmaceutical liquids and similar) | Source wavelength range | 255 ~ 1650 nm (multi-channel LED array) |
Measuring range | 0 ~ 40 % (customised to the medium) | Spectral resolution | 33 nm |
Accuracy | ± 0.1 (absolute accuracy, model R² > 0.99) | Wavelength accuracy | ± 1 nm |
Output parameters | Concentration / density / temperature / full spectral data | Wavelength repeatability | < 0.2 nm |
Wetted material | Sapphire (self-cleaning design) | Spectral window size | φ40 mm |
Measurement mode | Transmission / reflection (selected to suit the duty) | Optical path range | 1 ~ 40 mm |
Working pressure | ≤ 2.0 MPa (high-pressure version available) | Detector type | Si + InGaAs dual detector |
Operating environment | 0 ℃ ~ +60 ℃, ≤ 80 % RH | Ingress protection | IP66 |
Power supply | DC 24V / AC 220V | Explosion protection | Ex db ib IIC T6 Gb (optional) |
Total power consumption | ≤ 5 W | Analogue output | Dual 4-20 mA (≤ 750 Ω, NAMUR NE43) |
Digital communication | RS485 / Modbus RTU / Profibus-DP / HART / Bluetooth 5.3 / MQTT | Discrete output | Relay output (window alarm) |
Data storage | Circular storage of 10000 records | Algorithm | MLR multiple linear regression + Kalman + damping filter |
Display and operation | Local OLED + remote display (optional) | Certification | EU CE |
※ The product literature states an "operating environment of 0 ~ 60 ℃" but gives no upper limit for medium temperature. Where a measuring point involves a hot medium, the upper medium temperature limit must be confirmed with Pisonics during selection.
※ This application requires two components, available chlorine and free alkali, to be reported at the same measuring point, which makes it a multi-component modelling task. It should be noted that free alkali has no characteristic absorption of its own in the UV-visible region; its usable signal comes mainly from the way the O-H absorption band of water in the near infrared changes with alkali concentration and ionic strength. The free alkali channel is therefore more sensitive to temperature and to the concentration of co-existing salts, and the modelling samples must cover the actual range of variation in by-product sodium chloride content and medium temperature. Re-modelling is required after any change in feed alkali concentration or process formulation.
▍2.4 Selection and Installation Requirements (important)
The following conditions directly determine the stability of the measurement in the field. We recommend confirming them while the measuring point is still being designed; doing so avoids the great majority of post-commissioning disputes over deviation.
▪ First confirm that the medium meets the premise of the spectral method: the Beer-Lambert law requires absorption within the optical path to be predictable. A high concentration of suspended solids scatters light, and once conditions fall outside the modelled range the measurement is no longer valid — for solids-bearing slurries the PS7000 acoustic-impedance method should be selected instead.
▪ Every medium needs its own model calibration: MLR has to select characteristic bands from the multi-channel spectrum. After a change of medium, an adjustment to the formulation or a change in the main impurities, a new model is required and the old one cannot be carried over.
▪ The optical path is chosen by absorption strength: strongly absorbing media take a short path (1 ~ 5 mm) and weakly absorbing media a long one; the wrong path length leads either to signal saturation or to an inadequate signal-to-noise ratio.
▪ Window cleanliness belongs in the inspection routine: films, oil and crystalline layers all reduce transmittance and cause reading drift. For fouling duties we recommend automatic cleaning or wiping at scheduled shutdowns.
▪ Avoid locations where bubbles collect or phases separate: although the algorithm corrects for dispersed fine bubbles, a continuous gas phase or clear stratification makes the medium in the optical path non-uniform and distorts the reading.
▪ First establish whether anything precipitates in the circulating liquor: the by-product sodium chloride from hypochlorite synthesis may crystallise out when temperature falls or concentration runs high, and undissolved solids may be carried over from the base of the tower; countercurrent gas-liquid contact inside the tower also entrains bubbles into the circulating liquor. Suspended particles or a continuous gas phase in the optical path scatter light and push the reading outside the modelled range. The measuring point should be on the stable-flow section at the circulation pump outlet, away from the settled zone at the tower base and from any gas-liquid mixed-phase section.
▪ Select flow cell and seal materials for a strongly oxidising alkaline medium: the sapphire window itself resists sodium hypochlorite, but the flow cell body, gaskets and bypass valves must be confirmed at the same time — chlorine-bearing oxidising media are unkind to ordinary rubbers and to some metals. An isolatable sampling point should be provided on the bypass for taking reference samples during modelling and at quarterly cross-checks.
▍2.5 Field Calibration: multi-point modelling with sampling and laboratory comparison
Calibrating a spectral instrument is not like calibrating an ultrasonic or differential pressure device: it is not a matter of adjusting one coefficient but of **building an MLR model between concentration and the absorbance of characteristic bands**. Several sets of "spectral data + corresponding laboratory value" covering the normal working concentration range have to be collected, and the algorithm then selects the characteristic bands and performs the regression automatically.
The coverage of the modelling data sets the accuracy limit: an absolute accuracy of ± 0.1 presupposes a model quality of R² > 0.99, which will not be reached if there are too few sample points or the concentration span is too narrow. We recommend covering at least 5 ~ 8 concentrations initially, spanning the process upper and lower limits and the normal working points.
After commissioning, cross-check quarterly against sampled laboratory values; re-model after a change of medium batch, an adjustment to the formulation or replacement of the optical window.
3 Before / After Comparison
Aspect | Previous standard-solution titration method | PS7100 solution |
Data frequency | Once every 0.5 ~ 1 hour, limited by laboratory scheduling | Continuous online output, connected to the DCS |
Number of components | Available chlorine and free alkali require two separate titration procedures, so the data are not simultaneous | One instrument outputs both components from a single measurement |
Reagents and waste liquid | Standard solutions, indicators and glassware, generating chlorine-bearing waste liquid | No reagents, no dilution, no sampling; samples are taken only for comparison checks |
Personnel exposure | Every sample requires opening a valve and contact with a strongly oxidising alkaline liquid | Routine operation no longer requires scheduled sampling, markedly reducing the frequency of contact |
End-point determination | Based on a single titration reading plus the analyst's experience | Continuous curves give an objective basis for alkali make-up and discharge timing |
Maintenance points | The titration bench and standard solutions need regular preparation and standardisation | No moving parts; window cleanliness is part of the inspection routine, at an interval set by how fouling the medium is |
4 Field Verification and Operating Record
On the sodium hypochlorite synthesis unit of a chlor-alkali producer in East China, a PS7100 was installed in a bypass flow cell on the outlet circulation line of the hypochlorite reaction tower, downstream of the circulation pump. During modelling, multiple sets of "spectrum + titration value" samples covering the normal working range were collected, and after MLR had selected the characteristic bands both components — available chlorine and free alkali — were regressed together. Following commissioning, several rounds of comparison were made against laboratory titration values; the deviation between displayed and titrated values was within the range acceptable to the process, and the concentration trends corresponded to chlorine feed rate and alkali make-up actions.
Plant feedback: over roughly one year in service, alkali utilisation rose from about 88 % before the project to about 99 %, and the recorded product yield improved by about 10 %. It should be noted that yield and alkali utilisation are the combined result of chlorine feed control, tower temperature and spray distribution, feed alkali concentration and finished-product turnover; concentration measurement is only one link in that chain, the improvement should not be attributed in full to a single instrument, and the statistical conventions are best taken from the plant's own reports. What can be attributed directly to the instrument is this: available chlorine and free alkali went from discrete data points taken hourly at two different moments to two continuous curves at the same instant, alkali make-up and discharge timing acquired an objective basis, and operators no longer have to open a valve frequently just to obtain data.
A Note on Comparison Methodology Field comparison carries a methodological error of its own: the distance between the sampling point and the measuring point introduces a transport lag, and the representativeness of the sampling operation and the precision of the laboratory step both contribute deviation. We therefore avoid expressions such as "in complete agreement" and recommend instead that acceptance be based on the average deviation and trend agreement across several consecutive comparisons, with the sampling rules specified in an annex to the contract. Pisonics can supply a standard field comparison and acceptance procedure. |
▍Verifiable Benefits for the Customer
▪ Available chlorine and free alkali are output continuously at the same instant, so ratio and end-point decisions no longer depend on two titrations made at different times.
▪ Both over-chlorination and excess alkali can be seen coming in the trend, giving an objective basis for alkali make-up timing and for the chlorination end point.
▪ Routine operation no longer requires hourly scheduled sampling and titration, reducing laboratory workload and the volume of chlorine-bearing waste liquid generated.
▪ The plant reports improvements in both alkali utilisation and product yield (the result of several factors acting together; see the note in Chapter 4).
5 Frequently Asked Questions
Q1 Sodium hypochlorite decomposes naturally. Does the available chlorine at the measuring point represent what is in the product tank?
A Not directly, and this has to be made clear when the location is chosen. Sodium hypochlorite decomposes continuously in storage, at a rate that rises with temperature, exposure to light, falling alkalinity and catalysis by metal ions such as iron, copper and nickel. An instrument on the circulation line measures the stream passing the point at that moment, which is exactly the quantity needed to judge the reaction end point and alkali make-up timing; available chlorine in a product tank after several days of storage will be lower than it was at discharge. If real-time available chlorine in inventory is required, a separate measuring point should be provided on the product tank circulation line or discharge line — the two cannot substitute for one another. One detail is easily overlooked: precisely because of this decay, reference samples for modelling and quarterly cross-checks must be titrated as soon as possible; if a sample stands overnight before analysis, the decay error ends up charged to the instrument.
Q2 If the circulating liquor carries crystallised salt or bubbles, is the measurement still valid?
A This is the boundary that most needs settling in advance for the PS7100 in this application, and we do not avoid it. The spectral method rests on the Beer-Lambert law, whose premise is that absorption within the optical path is predictable: crystals of by-product sodium chloride precipitating at low temperature or high concentration, and bubbles entrained by countercurrent gas-liquid contact in the tower, both scatter light or make the medium in the path non-uniform; once conditions fall outside the modelled range the measurement is no longer valid, showing up as drifting or jumping readings. The engineering answer is to place the measuring point on the stable-flow section at the circulation pump outlet, away from the settled zone at the tower base and from gas-liquid mixed-phase locations. If the process makes this impossible to avoid — where the material is itself a slurry, has a high solids content or continuously carries gas — then the spectral method is the wrong choice: bubble-laden, high-solids slurries call for the PS7000 ultrasonic acoustic-impedance method (the sensor does not protrude into the flow path and the chirp signal penetrates bubbles), and where an existing plant does not allow the pipe to be tapped, the clamp-on PS7010 acoustic attenuation method can be used.
Q3 If a point needs only one concentration, does it still warrant the spectral method?
A No. During selection, first establish how many values the point actually needs. The value of the PS7100 lies in resolving several components at a single point. If only one concentration is needed and the medium is clean and homogeneous, the PS7020 sound-velocity method is simpler and less expensive. If a density resolution of the order of ± 0.001 g/cm³ is required for custody measurement or blending control, the PS7400 Vibrating Fork Density Meter is a better fit (Pisonics has a corresponding case in caustic soda storage and transfer). Splitting a two-component requirement across two single-component instruments is usually poor value; equally, applying multi-component modelling where only one value is needed is a waste.
Q4 Does the optical window actually touch the medium? Can it become fouled?
A It does. The wetted material is a sapphire optical window. "No reagents, no sampling, non-destructive" means that no reagents are consumed and no sample has to be removed; it does not mean the probe is out of contact with the medium. Sapphire has a self-cleaning design and resists fouling, but for heavily fouling media window cleanliness should still be part of the inspection routine — a fall in transmittance translates directly into reading drift. The product that genuinely does not touch the medium is the clamp-on PS7010 (acoustic attenuation method).
Q5 Can it be used on a different medium? What has to be redone?
A A new model is required. The concentration value from the PS7100 comes from an MLR regression on the absorbance of characteristic bands, and the model is tied to the medium. After a change of medium, an adjustment to the formulation or a change in the main impurities, fresh "spectrum + laboratory value" samples have to be collected and the model rebuilt. This should be settled with the process people during selection, so that a frequently changing medium does not come to light only after commissioning.
Q6 Should this point use the PS7100 or a different model?
A The strength of the PS7100 (spectral) is multi-component identification — choose it where several constituents have to be resolved at one point. For a binary or near-binary system in a coloured or bubble-bearing medium, the PS7110 Inline Refractometer is simpler and more robust. For bubble-laden, high-solids slurries choose the PS7000 (ultrasonic acoustic impedance); where the pipe cannot be tapped, the clamp-on PS7010; for a single concentration in a clean liquid, the PS7020 (sound velocity); for clean chemical liquids needing ±0.001 g/cm³ resolution, the PS7400 Vibrating Fork Density Meter; for large tanks and large-bore, low-abrasion duty, the PS7300 Differential Pressure Density Meter; for custody-transfer-grade mass flow, the PS7200 Coriolis Density Meter; and for aqueous suspensions, the PS7600 Microwave Concentration Meter.
About Pisonics
Xi'an Pisonics Information Technology Co., Ltd. (PISONICS) specialises in industrial online density and concentration measurement. Its product range covers ultrasonic acoustic impedance, ultrasonic sound velocity, clamp-on acoustic attenuation, spectral, refractometric, vibrating fork, differential pressure, Coriolis and microwave measuring principles, so that a suitable solution can be matched to each duty, and it is in service in the chemical, petrochemical, power, metallurgical, pharmaceutical, food and municipal industries.
Inline Density & Concentration Measurement
Company | Xi'an Pisonics Information Technology Co., Ltd.PISONICS |
Address | Room 15B016, Block A, Olympic Building, North Chang'an Road, Beilin District, Xi'an, Shaanxi, China |
Tel | +86 159-0293-2017 |
info@pisonics.com | |
Web | Chinese site www.pisonics.cn | English site www.pisonics.com |
※ The process data and operating records in this case are compiled from an actual project; Figure 1 is a process layout diagram, not a measured record trace. Instrument specifications and the installation and calibration requirements are governed by the technical documentation supplied with the goods, and are subject to change without notice.