Pisonics PS7000 Goes Live on a Phosphate Rock Slurry Feed Line: Inline Density on the Riser After the Pump
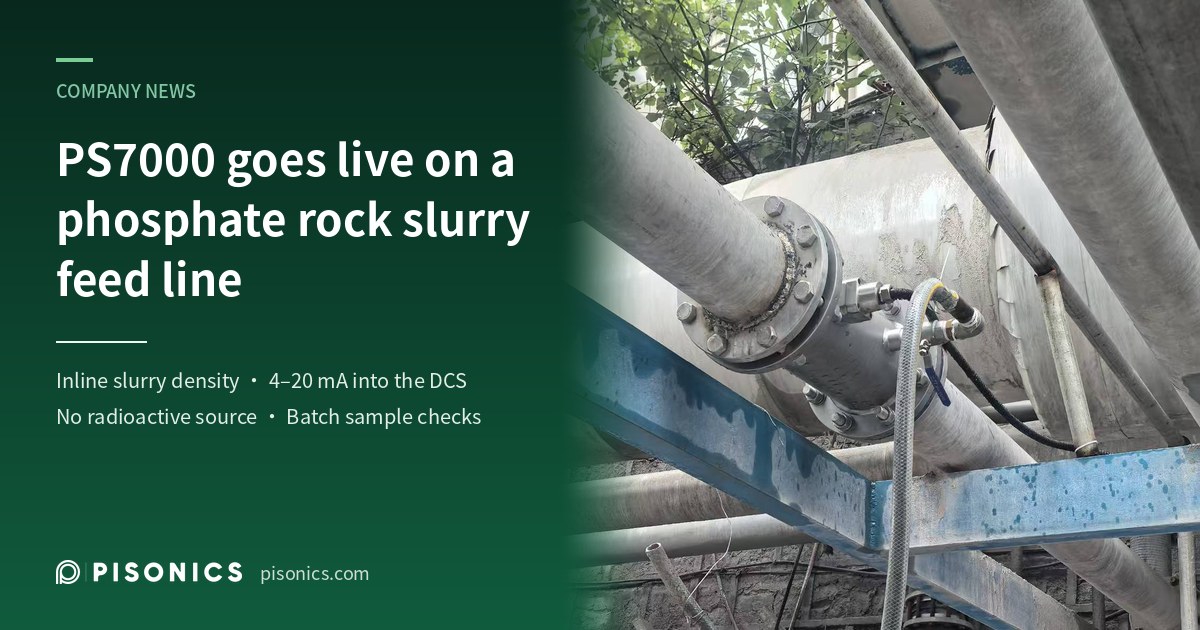
At a phosphate chemical producer in southwest China, a Pisonics PS7000 ultrasonic slurry density meter is running on a phosphate rock slurry feed line: the measuring spool sits on the vertical riser after the tank outlet pump, with a sampling valve just above the sensor, a 4–20 mA signal into the DCS, and no radioactive source. Since late March 2026, the site has compared it with weighed samples batch by batch.
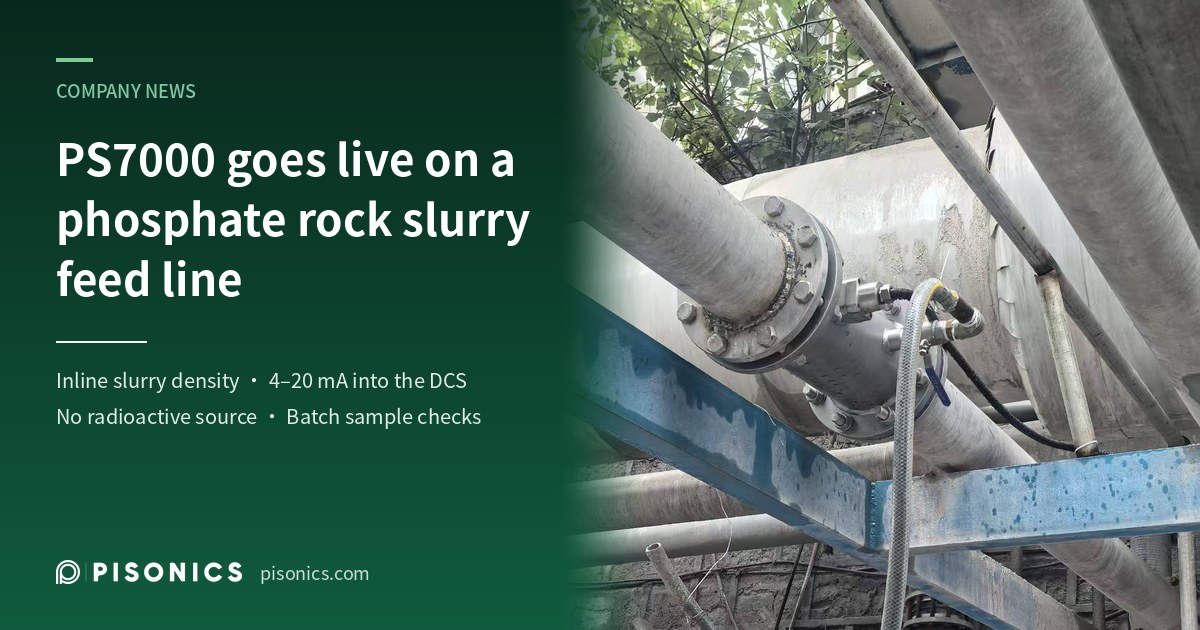
A Pisonics PS7000 ultrasonic slurry density meter is running on a phosphate rock slurry feed line at a phosphate chemical producer in southwest China. The measuring point is on the vertical riser after the pump at the slurry tank outlet, where the meter measures the density of the phosphate slurry on its way to the reaction tank. Its 4–20 mA output goes into the DCS as the feed slurry density, and no radioactive source is involved. Since late March 2026, the site has compared the meter with weighed samples, batch by batch.
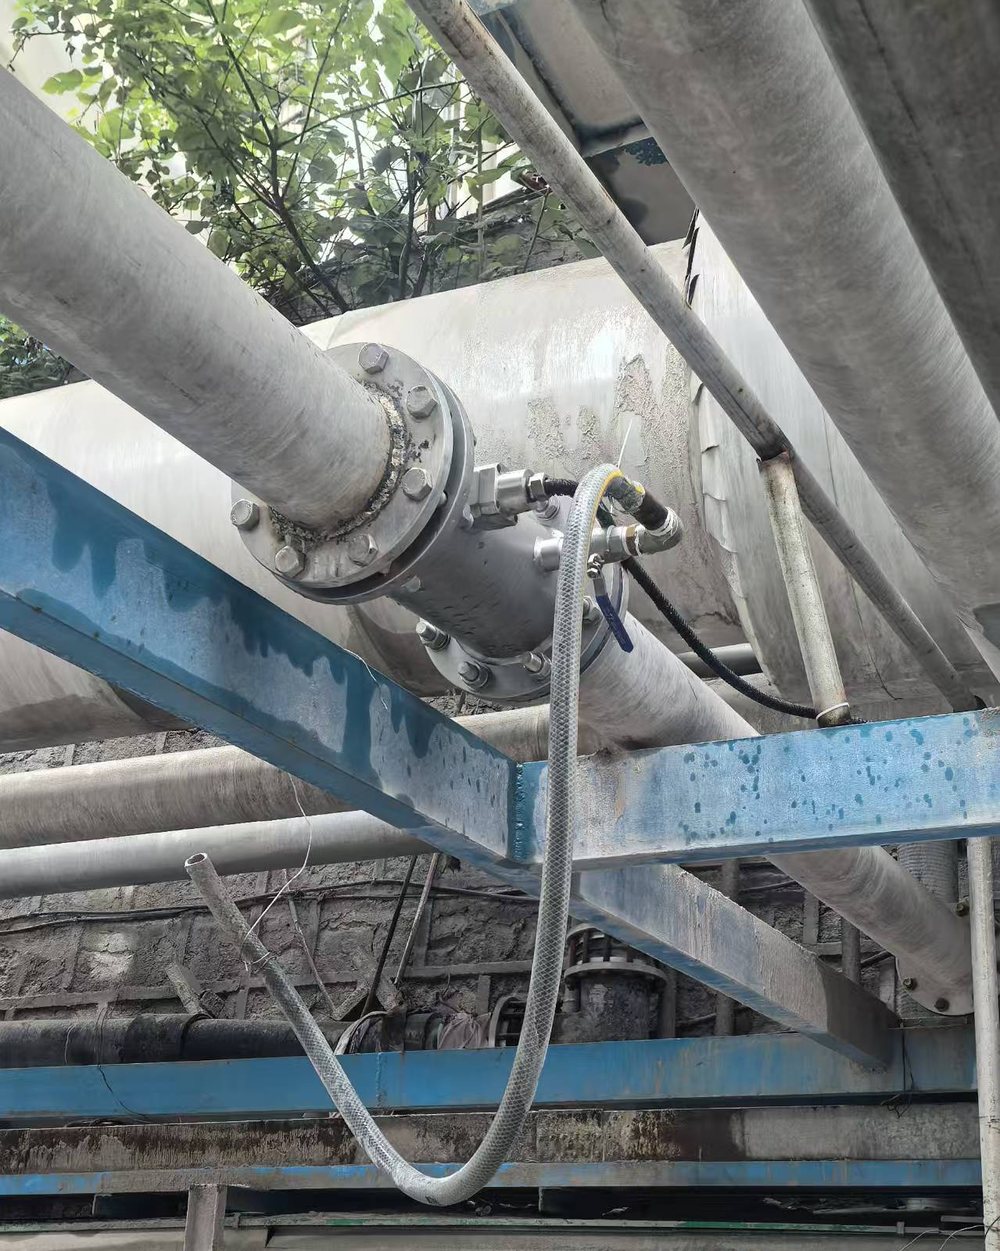
The measuring spool on site, carrying the PS7000 sensor and a sampling port with a ball valve; a hose runs down from the sampling port.
Process conditions at the measuring point
Item | Details |
|---|---|
Measuring point | Vertical riser of the feed line after the pump, at the outlet of a 3,000 m³ slurry tank |
Medium | Phosphate rock slurry, a blend of coarse and fine slurries fed into the tank |
Density | About 1.70–1.94 g/cm³ (weighed samples), mostly 1.75–1.86 |
Pipe | DN150 riser; measuring point about 6 m above ground |
Flow | Varies with production, typically about 70–140 m³/h |
Mounting | Flanged measuring spool; sensor inserted horizontally; sampling valve about 200 mm above the sensor; remote transmitter |
Output | 4–20 mA into the DCS as the feed slurry density |
Comparison | Since late March 2026: weighed samples about every 2 hours, compared batch by batch |
Why measure phosphate slurry density online
Phosphate slurry is pumped from the tank to the reaction tank. What the pipe delivers is a volume of slurry, but how much rock reaches the reaction tank depends on the solids in it: at the same flow, a slightly higher or lower density means different amounts of rock and water, and the downstream proportioning has to follow.
The slurry in the tank is not uniform either. Here, coarse and fine slurries are blended and pumped into the tank, and the outlet slurry runs denser when the tank level is low and thinner when it is high. Without an inline instrument, the only source for this number is periodic sampling and weighing by the operators, which lags behind the process and misses whatever happens between samples.
Inline slurry density has traditionally been measured with nuclear density gauges, which need a radioactive source licence, radiation protection and periodic inspection, and the source has to be disposed of at the end of its life. PS7000 measures ultrasonically, so none of these steps apply.
What makes this measuring point difficult
- A dense slurry with a changing feed. At about 1.7–1.9 g/cm³ the slurry settles as soon as the pump stops. The feed is a blend of coarse and fine slurries, and the ore source, particle size and blend ratio all change. PS7000 measures the acoustic impedance of a thin layer of slurry at the sensor face, so a coarser or finer feed shifts the reading, and calibration has to follow the actual feed.
- Changing flow and operation. Flow to the reaction tank varies with production, typically about 70–140 m³/h, and the feed pump stops and restarts fairly often. While it is stopped, the slurry in the riser settles, and after a restart the reading takes a while to steady.
- A measuring point up high. The meter is on a riser about 6 m above ground, so sampling and inspection mean climbing up. Routine comparison samples are taken at the pump suction, with a pump and a length of pipe between the sampling point and the meter.
How PS7000 is installed and how it measures
- On the vertical riser after the pump. The measuring spool is fitted into the DN150 riser, so the slurry flows upward past the sensor and the pipe runs full in operation; when the pump stops, there is still slurry at the sensor.
- Sensor inserted horizontally, face flush. The sensor face is flush with the spool bore and does not protrude into the flow, so there is no head-on erosion or build-up at the sensor root.
- Sampling valve beside the meter. A sampling port with a ball valve sits about 200 mm above the sensor, used to check whether the pump-suction samples and the slurry at the meter are the same stream. Two rounds of simultaneous sampling at both points gave essentially the same result.
- Single-sensor, reflective measurement. PS7000 uses a linear frequency-modulated (chirp) acoustic impedance method: one sensor transmits and receives, and the measurement takes place at the interface between the sensor face and the slurry. The acoustic window is sapphire, for wear and corrosion resistance.
- Bubble interference made visible. The wide-band chirp signal helps suppress multiple reflections caused by bubbles, and the meter also outputs a 0–100 aeration index and a bubble flag, so bubble interference can be told apart from a genuine change in density.
- Into the DCS. Two 4–20 mA outputs (NAMUR NE43) and RS485 Modbus-RTU are available; here a 4–20 mA output goes into the DCS as the feed slurry density. Every meter has Bluetooth, so readings and calibration are also available on a phone app close by.
- No radioactive source, remote transmitter. No source licence and no source handling, inspection or decommissioning burden; the transmitter is mounted remotely, so only the cable runs to the sensor.
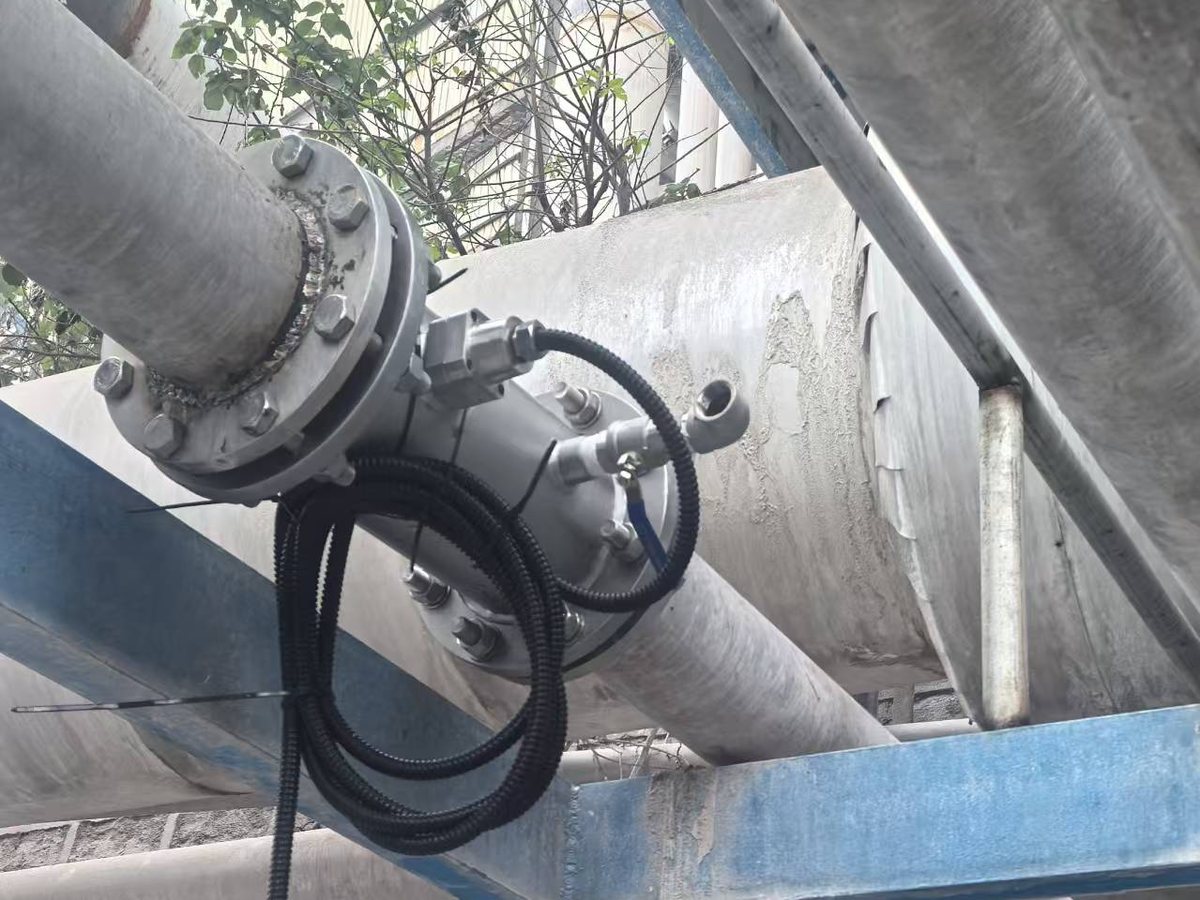
During installation: the measuring spool is in the line, and the sensor cable, in black corrugated conduit, is coiled beside the spool awaiting connection.
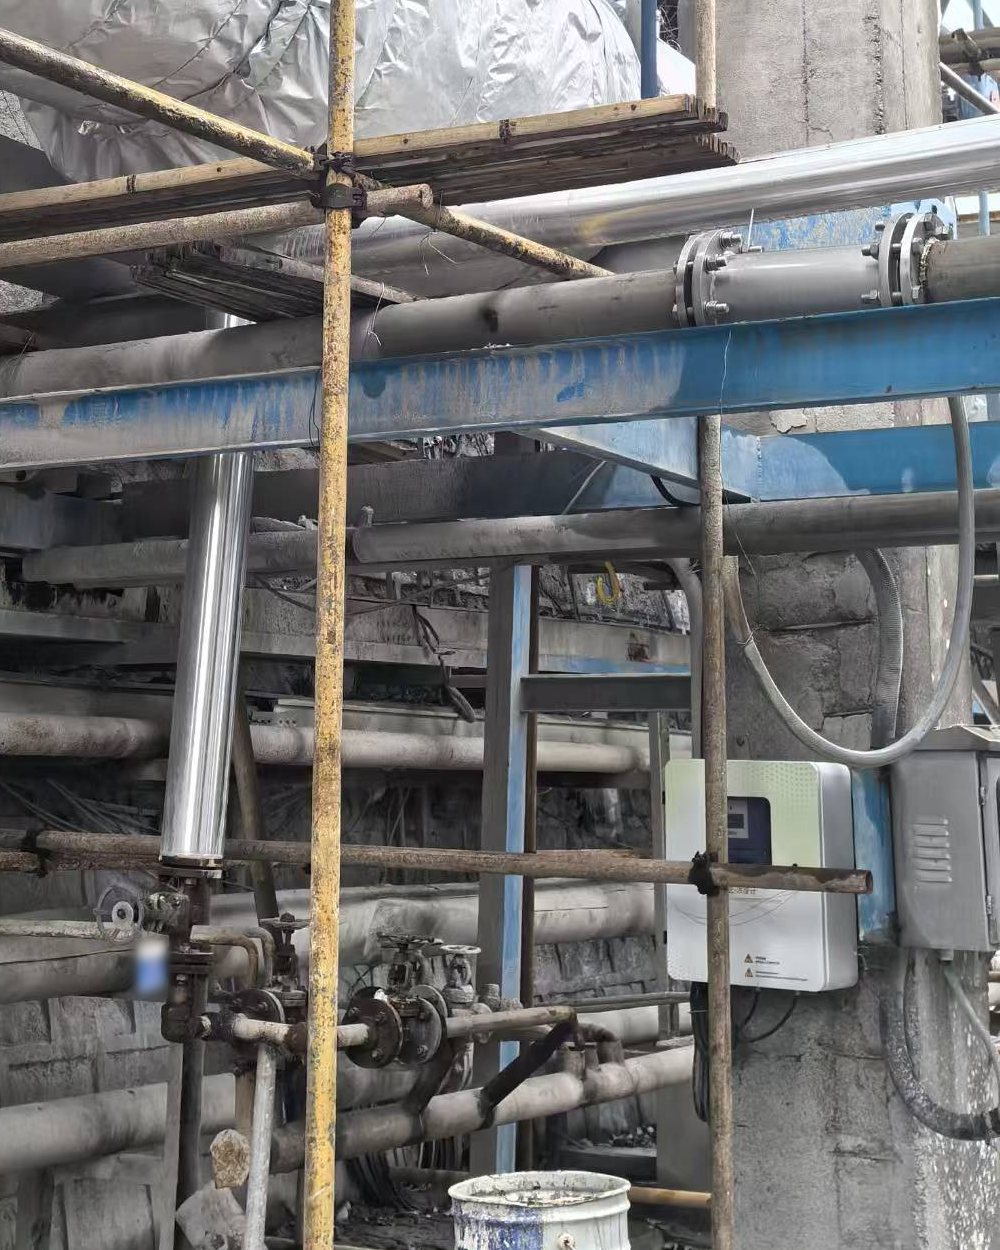
The transmitter enclosure, remote-mounted on a concrete column (white enclosure, lower right).
Field notes from the on-site comparison
- Weigh samples, compare batch by batch. Operators draw a sample at the pump suction about every 2 hours and weigh it in a fixed-volume cup to get its density, which is compared with the meter reading at the same moment and summarised batch by batch. With a distant sampling point and a changing process, a deviation may not come from the meter at all (see Low One Day, High the Next — Why Bidirectional Deviation Proves the Meter Right).
- Take the reading from the DCS or PC log. For comparison, use the value logged by the DCS or the PC software at the same moment rather than a hand-copied estimate, and line up the clocks: the systems on site can be more than ten minutes apart.
- Zero with water when you can. In mid-September the site could fill the line with clean water for the first time, and a two-point calibration with water and slurry corrected the meter's zero reference.
- Do not chase the zero after a restart. After a stop, the slurry in the riser settles, and the reading takes from a few hours to two or three days to settle after the restart. The rule on site is not to evaluate for 72 hours after a restart, and to decide on any zero adjustment only from the average over a run of at least 72 hours without stops, never from a single point.
- Log the flow as well. At the same density, a large cut in flow to the reaction tank — and so a lower velocity in the riser — shifts the reading as a whole, and it returns once the flow recovers. Record the flow with every comparison, and calibrate at the usual flow.
- Recalibrate when the feed changes. A clear change in ore source, particle size or blend ratio calls for recalibration. Where a few fixed blends alternate, calibrate each separately and store them as separate calibration sets (the meter has 40 independent calibration areas), switching with the operating mode.
About Pisonics
Pisonics specializes in industrial-grade online density and concentration measurement, delivering sensor-to-cloud solutions for mining, energy, chemicals, pharmaceuticals, new energy, municipal and other sectors.
Contact: service@pisonics.com
Related reading