An iron-ore concentrator in northern China ran a two-day comparison between an inline density meter reporting mass solids (wt %) and manual sampling with oven drying — 16 paired points in total.
At first glance the data looked bad. Some points read 8 percentage points below the sample, others 10 points above. The customer's question was blunt: is this meter accurate or not?
Separate steady state from transients first
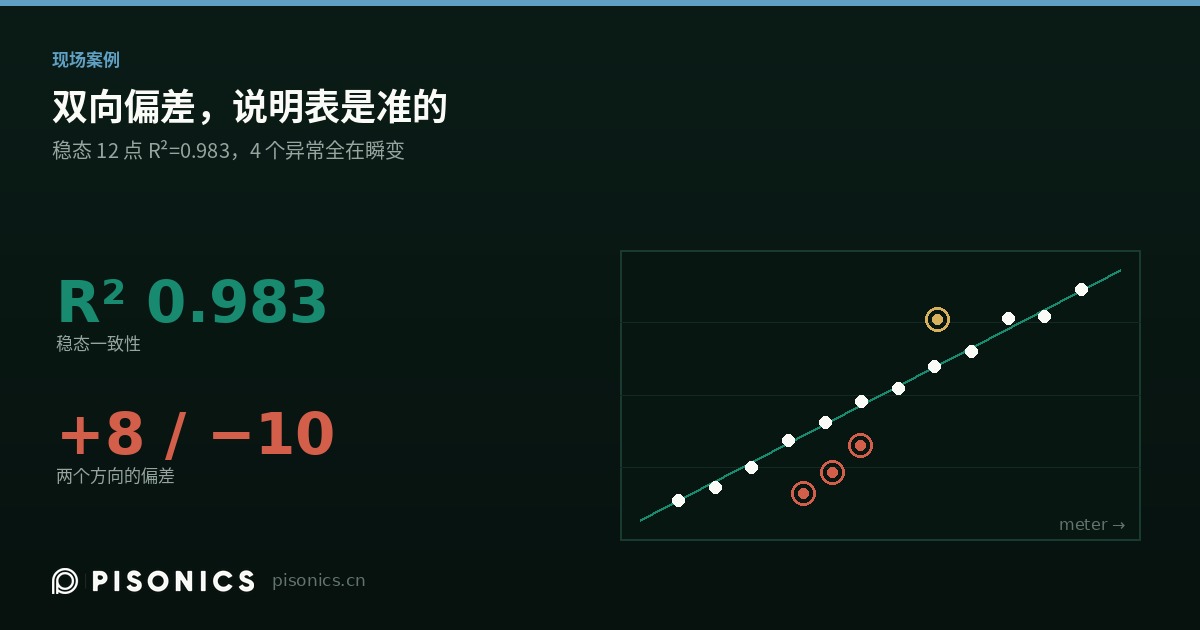
Setting aside four points that fell in start-up or transient periods, the remaining 12 steady-state points give:
Metric | Value |
|---|---|
Mean bias | +0.18 |
Mean absolute error (MAE) | 0.44 |
RMSE | 0.53 |
Maximum deviation | 1.18 |
Regression | sample = 1.27 + 0.983 × meter |
R² | 0.983 |
Two independent days, steady-state agreement around ±0.5, regression slope close to unity. The calibration is correct.
So what about the four outliers? The key observation is that they are bidirectional — three points low on day one, one point high on day two.
This matters enormously. A calibration error or a fixed installation bias produces a constant offset in one direction. One low and one high rules both of those out immediately. The explanation has to lie in process conditions or in the comparison method.
The three low points: stratification in the horizontal run
The piping topology: low-level source (pump and valve) → riser → horizontal run (meter here) → a second riser of about 20 m → manual sampling point → agitated tank.
Iron ore has a solids specific gravity near 5, far heavier than general slurry, so its critical deposition velocity is correspondingly higher. During low-flow operation that afternoon, the horizontal run stratified: dense at the bottom, dilute on top. The probe reads the layer at the wall, and that layer really was more dilute.
The clinching evidence: samples at 16:13 and 16:15 were almost identical in concentration (57.39 → 57.16), so the process itself was not moving. Yet those two points showed the largest deviations (+8 and +7). A stable process with maximum deviation can only mean the layer the sensor sees is not representative of the bulk.
The one high point: 150 metres of spatial lag
At 12:13 on day two the meter read 45.85 against a sample of 35.61 — a gap of 10.24 points. From 12:20 onward, seven consecutive points all fell within ±0.71.
The critical fact is that the sampling point sits roughly 150 metres downstream of the sensor.
In the seven minutes from 12:13 to 12:20, concentration climbed from about 36 % to about 64 % — over 4 % per minute. With a 150 m transport distance, the sampling point lags by 1 to 2.5 minutes, so it captured the dilute leading edge while the slurry at the sensor had already risen with the real process.
The sign is consistent too: on a rising ramp, a downstream sample must be more dilute, so sample < meter. This point is quite probably not an instrument error at all, but a spatial-temporal mismatch in the comparison method under a steep ramp.
What to change
- Move the sensor to an adjacent riser — the site already has two. Upward flow keeps solids suspended, self-vents, and stays full, which eliminates the stratification failure entirely
- Add a sampling point immediately next to the sensor and compare only under steady state. Keep the 150 m point for trend reference only
- If the horizontal run must be kept, hold velocity above the critical deposition threshold and do not compare during low-flow operation
- Flag start-up, ramp and low-flow data as "unstable process" and exclude it; read the meter alongside flow rate
The transferable lesson
When a comparison shows deviation, first check whether the deviation is one-directional. Bidirectional deviation almost always comes from process conditions or comparison method, not from instrument accuracy. And the further your sampling point sits from the measurement point, the less you are comparing the same slurry — 150 m is enough to manufacture a 10-point phantom error on a steep ramp.
Pisonics — Xi'an Pisonics Information Technology Co., Ltd.
Room 15B016, 16F, Block A, Olympic Building, No.14 Chang'an North Road,
Beilin District, Xi'an, Shaanxi 710061, China
+86 159 0293 2017 | info@pisonics.com | www.pisonics.com
Send us pipe size, velocity, particle size distribution and whether the line
carries entrained air, and we will tell you which principle fits your line —
including the cases where ours does not.