A food and pharmaceutical extraction customer recovering three solvents: ethanol 70 → ≥92 wt %, isopropanol 60 → ≥84 wt %, acetone 25 → ≥98 wt %. The three are stored in separate tanks and processed in batches, switching every few days — one pipe carrying one medium at a time.
Establish first whether the point is on the feed side or the product side
It took two rounds of questions to pin this down.
The feed side contains water, animal and vegetable fats and protein — a four-component collinear system, with protein that films over an optical window. A proposal on that side simply does not stand up.
The actual measurement point is on the product side, after distillation — a clean binary system of solvent plus residual water. Whether a proposal is viable at all rests entirely on this one fact.
For similar enquiries: confirm where in the process chain the measurement sits before discussing any solution.
The blind spot in density measurement: it cannot tell you which liquid it is
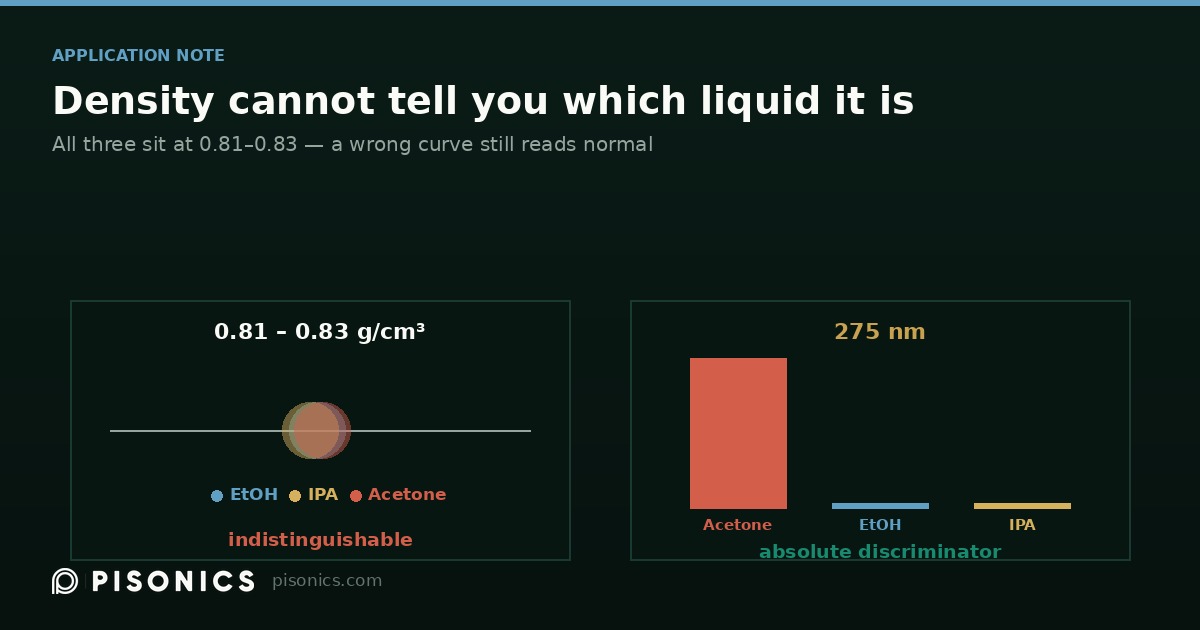
All three solvents have densities crowded into 0.81–0.83.
That means: if the wrong curve is selected — isopropanol in the line while the instrument computes on the ethanol curve — the number produced looks perfectly normal. Nothing in the measurement can detect the error. For product that has to meet food-additive standards, that is an unacceptable silent failure.
How spectroscopy resolves it
275 nm is an absolute discriminator for acetone. Acetone absorbs strongly there and is completely opaque at millimetre path lengths; both alcohols are completely transparent. A binary signal with no ambiguity.
Distinguishing ethanol from isopropanol relies on C–H band shape, with only moderate confidence. So the design is: take medium identity primarily from valve position or a DCS signal, and use the spectrum as a cross-check and alarm — guarding against the silent error of a wrongly selected curve.
One instrument and one flow cell are sufficient. Path length is optimised for the hardest case, acetone at 0–2 % residual water, and an 8× range difference is covered by switching wavelength bands: acetone on a strong water band, isopropanol moved to a weak one, ethanol in between on a lower lamp current setting.
A bonus: 275 nm doubles as a protein-carryover alarm
The feed contains protein and fats, and entrainment at the column top would contaminate food-additive-grade product. The same 275 nm channel monitors this simultaneously — something density measurement cannot provide at all.
How to frame accuracy
Recovery ≥97 % and the concentration specification pull against each other, so the plant will inevitably run permanently close to the specification line.
Accuracy should therefore be discussed as "resolving 0.2–0.5 wt % in the vicinity of the specification line" rather than as a full-range accuracy commitment. It matches how the instrument is actually used, and it is more honest.
Engineering details
- Measurement temperature is confirmed at 20–35 °C, well below all three boiling points, so flash bubbles at atmospheric pressure are not a concern
- A 15 K spread is still significant in the near infrared: calibrate at 20/27/35 °C, with the temperature sensor integrated into the flow cell body at the same point as the optical path
- Hold the output during medium changeover and release on a stability criterion
- The empty-pipe interval between tank changes is a natural zero-check window; capturing that baseline automatically is worth building in
Pisonics — Xi'an Pisonics Information Technology Co., Ltd.
Room 15B016, 16F, Block A, Olympic Building, No.14 Chang'an North Road,
Beilin District, Xi'an, Shaanxi 710061, China
+86 159 0293 2017 | info@pisonics.com | www.pisonics.com
Send us pipe size, velocity, particle size distribution and whether the line
carries entrained air, and we will tell you which principle fits your line —
including the cases where ours does not.