Type: Field case slug: fgd-gypsum-curve-three-patterns
A coal-fired power plant in northern China, inline density meter on the gypsum bleed line at the absorber outlet. Instrument self-diagnostics were entirely healthy — fault code 0x0, signal quality 0.905. But three odd waveform patterns kept appearing on the DCS trend, and operations wanted to know what each one meant.
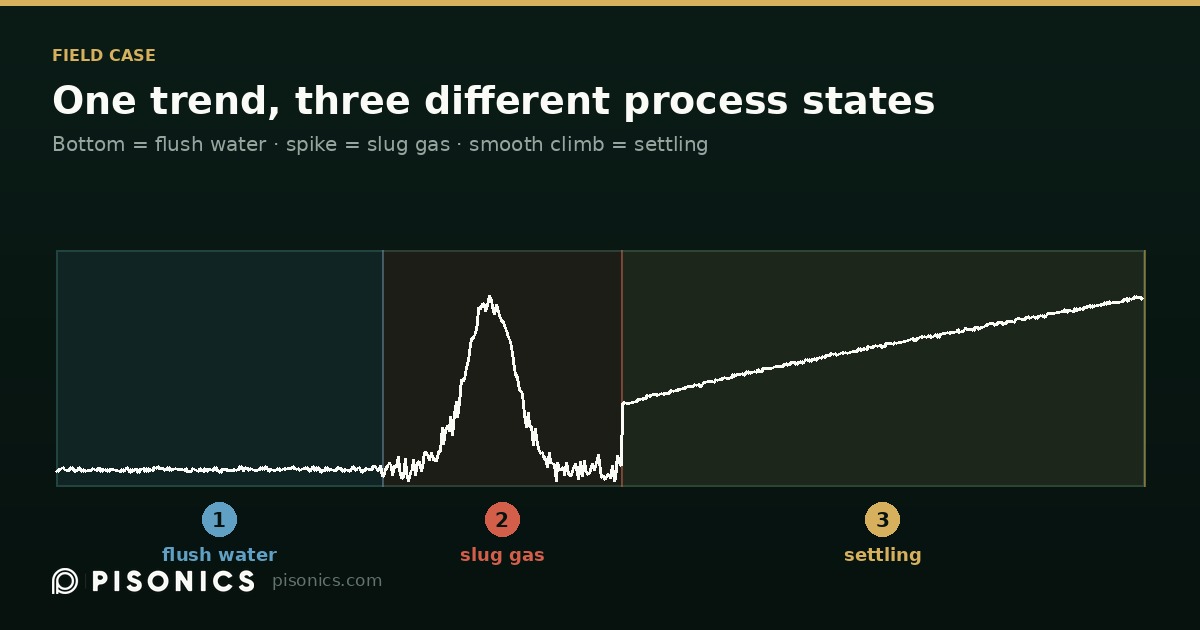
Pattern one: a long flat segment against the bottom of the range
The reading falls to near 1000 kg/m³ and stays there, or forms the lower edge of a square wave.
This is flush water in the line after bleed stops — genuinely clean water, and the reading is correct.
Worth emphasising: this is not an empty pipe. An empty pipe behaves in the opposite direction — the gas/probe interface approaches total reflection, the instrument receives no valid echo, and the reading clamps to the top of the range, not the bottom. Do not confuse the two.
Pattern two: a short spike at pump start
The reading briefly jumps to 1140–1210, then falls back.
Two things superimposed: slug gas in the line and aeration bubbles from the oxidation air, on top of genuinely thicker slurry drawn from the absorber sump on start-up. Dispersed bubbles push the reading in the same direction as genuinely higher solids, so the spike is a mixture of real and artefact.
The way to tell them apart is the entrained-air diagnostic index output alongside the primary variable: if density rises and the air index rises with it, bubbles are contributing.
Pattern three: a smooth monotonic climb
This is the deceptive one — the reading climbs smoothly from 1080 to 1223 over about an hour, on a very clean curve that looks like the process steadily thickening.
It is actually stagnant settling after the pump stops, with slurry settling out and progressively fouling the probe face.
Three independent pieces of evidence:
- Probe temperature falls at a constant slope from 47 °C to 45.5 °C — only the absence of flow removing heat produces this smooth exponential cooling
- Echo-energy fluctuation drops from >15 to <5 — the bubble disturbance that flow brings has disappeared
- Echo energy falls monotonically while the primary variable rises monotonically — the signature of an interface being progressively blocked by deposit
All three point to the same conclusion: nothing is flowing. The steadiest-looking segment of the trend is precisely the segment where the instrument has stopped seeing the process.
Countermeasures
- Gate the reading on the bleed pump running signal in the DCS: hold the last valid value during stops and flushing, to avoid spurious gypsum-bleed interlock triggers
- Relocate the measurement point to a riser — same recommendation as the iron-ore case above
- Inspect the probe face for gypsum scale
The transferable lesson
On a single trend, "pinned at the bottom of the range" and "smoothly climbing" are usually flow-state signals rather than process signals. When reading an inline density trend, asking "was the pump running during this period?" gets you further than asking "why did concentration change?"