See your dredge production in real time
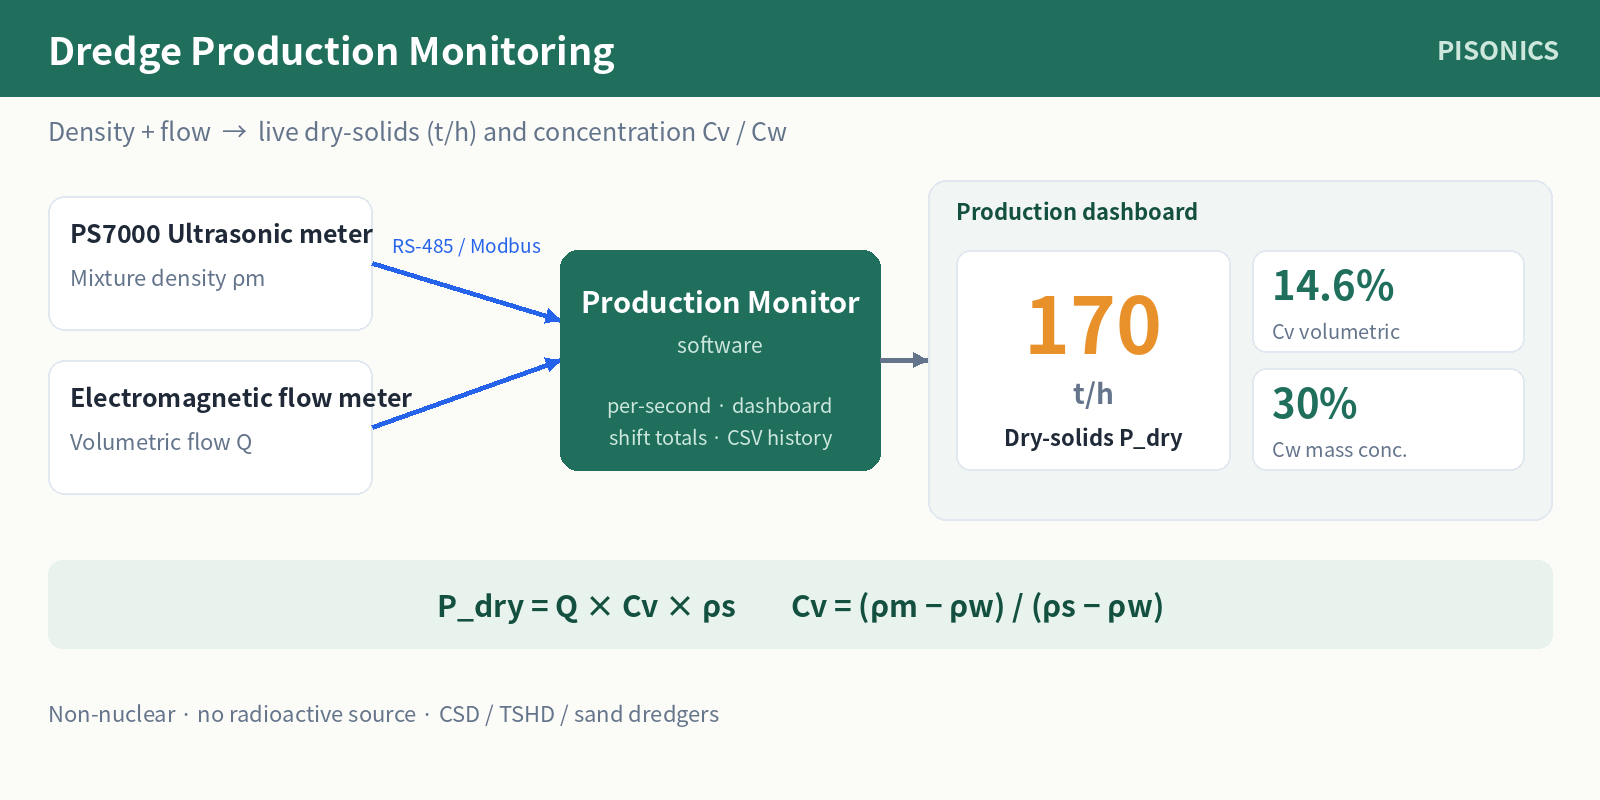
A dredger’s value is the dry solids it actually moves — but density alone doesn’t tell you that. The Pisonics Dredge Production Monitor fuses an inline PS7000 slurry density meter with an electromagnetic flow meter (both on RS-485 / Modbus-RTU) and computes production every second: dry-solids output Pdry (t/h), volumetric concentration Cv, mass concentration Cw, specific gravity and line velocity — shown on a dashboard with shift totals, a live trend, alarms and CSV history.
What it computes
| Value | Formula | Why it matters |
|---|---|---|
| Volumetric concentration Cv | (ρm−ρw) / (ρs−ρw) | How much solid is in the mixture |
| Dry-solids production Pdry (t/h) | Q × Cv × ρs | Your actual output — the number that pays |
| Mass concentration Cw | Cv × ρs / ρm | Reporting & billing |
| Line velocity v (m/s) | Q / (A × 3600) | Stay above the critical (settling) velocity to avoid blockage |
Worked example: ρm=1.22, ρw=1.00, ρs=2.50 t/m³, Q=465 m³/h on a DN200 (8″) line → Cv≈14.6%, Pdry≈170 t/h, Cw≈30%, v≈4.0 m/s. Full method in the production-calculation guide.
Why crews use it
- Optimise production — trim to the sweet spot of concentration vs velocity instead of guessing.
- Prevent pump blockage — line-velocity and density-gradient alarms feed the DCS / pump-speed interlock (4-20 mA / RS-485 / HART).
- Report & bill by shift / vessel / project — every second logged; CSV export.
- Non-nuclear — no radioactive source, so no shipboard radiation licence, no port-inspection delays, no radiation-safety officer.
What’s in the system
Density: PS7000 ultrasonic (clamp-on or wetted, DN50–DN1000). Flow: electromagnetic flow meter. Software: Dredge Production Monitor (Windows), embedded database, bilingual UI. Works on cutter-suction (CSD), trailing-suction hopper (TSHD) and sand dredgers. See the dredger density solution, the dredging industry page, or a real deployment in the overseas CSD case study.
Tell us your pipe size and dredger type for a recommendation.